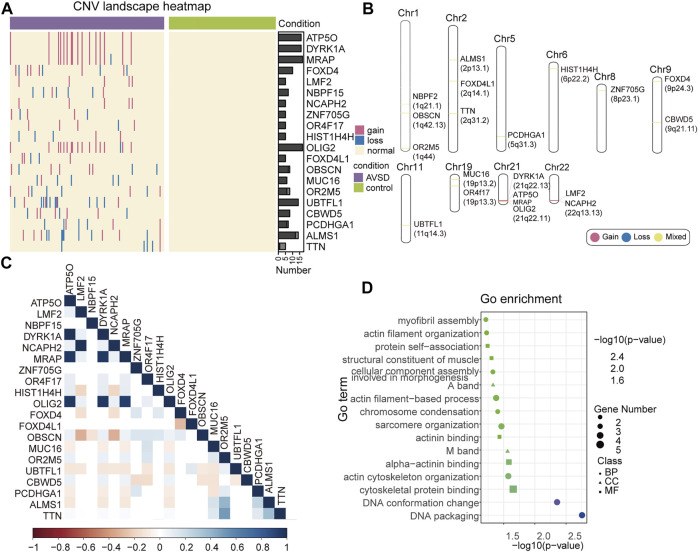
FIGURE 3.
The landscape of candidate gene. (A) Heatmap of 20 candidate genes expression. The red line represents gene duplication, the blue line represents gene deletion, the normal subjects are depicted in yellow. (B) Candidate genes in the chromosomes. Gene deletions and duplications are shown in blue and red, genes with both variation types are show in yellow. (C) Correlation heatmap of candidate gene. The color bar indicates the corresponding R-value. (D) GO analysis of candidate genes. GO enrichment analysis in DAVID includes biological processes (BP), cell component (CC), and molecular function (MF). The x-axis shows the -log10 p-value. The number of candidate genes annotated with a GO term is mapped to the scatter plot by point size.

