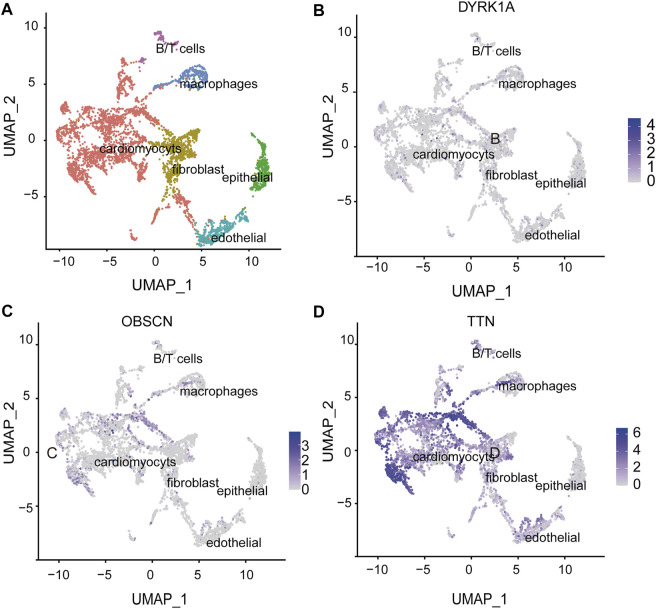
FIGURE 5.
The spatial expression of potential risk genes in the heart. (A) Single-cell atlas of embryonic hearts cells. Uniform manifold approximation and projection (UMAP) plot illustrate six clusters of human embryonic hearts cells. (B–D) The spatial expression of DYRK1A, OBSCN and TTN in the heart cell clusters. The intensity of the blue point represents the extent of genes expression. DYRK1A, dual-specificity tyrosine-(Y)-phosphorylation regulated kinase 1A; OBSCN, Obscurin; TTN, Titin.

