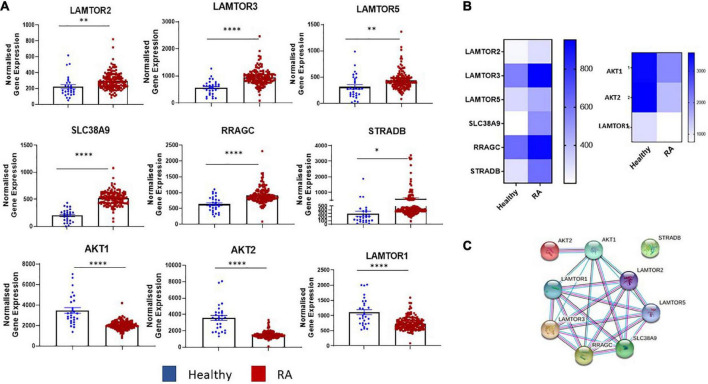
FIGURE 1.
Dysregulated expression of the mTOR pathway in RA synovial tissue. (A) Bar graphs demonstrating normalized gene expression of key components in the mTOR pathway (LAMTOR1, LAMTOR2, LAMTOR3, LAMTOR5, SLC38A9, RRAGC, STRADB, AKT1, and AKT2) via transcriptomic analysis of RNA-Seq (GEO database GSE89408) on synovial tissue biopsies from healthy donors (n = 28) RA patients (n = 151). (B) Clustered heatmap representing DEG involved in metabolism (mTOR pathway) from RASF compared to healthy controls. (C) Known and predicted interactions of dysregulated genes in mTOR pathway. Non-parametric unpaired Mann–Whitney t-test used for comparisons between healthy donors and RA patients. *p < 0.05, **p < 0.01, ****p < 0.0001.

