FIGURE 2.
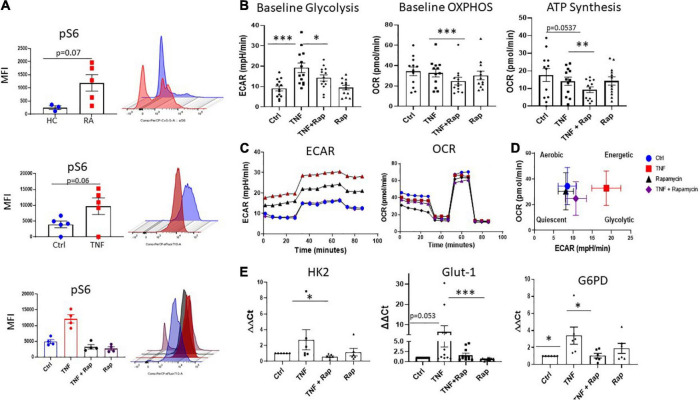
Inhibition of mTOR in RA synovial fibroblasts alters cellular metabolism. (A) Representative bar graphs showing MFI expression of the downstream mTOR marker pS6 in healthy donors (n = 3) and RA patients (n = 5) as well as pS6 expression in RASF (n = 5) treated with TNFα (1 ng/ml) for 24 h compared to basal control and RASF (n = 4) treated with TNFα (1 ng/ml) and Rapamycin (100 nM) alone or in combination for 24 h. (B) Representative bar graphs demonstrating baseline glycolysis, baseline OXPHOS (oxidative phosphorylation), and ATP synthesis, in RASF treated with TNFα (1 ng/ml) and Rapamycin (100 nM) alone or in combination for 24 h (n = 12–13). (C) Average seahorse profiles demonstrating extracellular acidification rate (ECAR) (glycolysis) and oxygen consumption rate (OCR) (oxidative phosphorylation), before and after injections of oligomycin, FCCP, and antimycin A and rotenone in RASF. (D) Metabolic phenotype profiles in RASF representing changes in metabolic phenotype in response to TNFα (1 ng/ml) and Rapamycin (100 nM) alone or in combination for 24 h. (E) Bar graphs demonstrating mRNA gene expression of hexokinase 2 (HK2), glucose-6-phosphate dehydrogenase (G6PD), and glucose transporter 1 (GLUT-1), in RASF (n = 6–11). Fold increase compared to endogenous controls (RPLPO and HPRT1). Values expressed as mean ± SEM, Mann–Whitney t-test used for comparisons between healthy donors and RA patients. Wilcoxon signed rank test used for RASF, *p < 0.05, **p < 0.01, ***p < 0.001.

