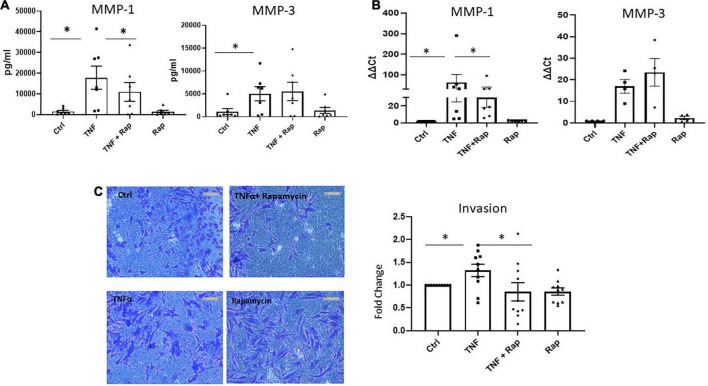
FIGURE 4.
mTOR inhibition in RA synovial fibroblasts decreases cellular invasion. (A) Bar graphs showing the measured secretion of MMP-1 and MMP-3 from RASF cultured in the presence of TNFα (1 ng/ml) and Rapamycin (100 nM) alone or in combination for 24 h (n = 7). (B) Bar graphs showing gene expression of MMP-1 and MMP-3 from RASF (n = 4–7). Gene expression analysis quantified using Real-time PCR. Fold increase compared to endogenous controls (RPLPO and HPRT1). (C) Representative photomicrographs of RASF invasion along with accompanying bar graph quantifying invasion (n = 10). Following 48 h stimulation, invading cells attached to lower membrane were fixed (1% paraformaldehyde) and stained (0.1% crystal violet). Values expressed as mean ± SEM, Friedman Test with Dunn’s multiple comparison and Wilcoxon signed rank test used for RASF. *p < 0.05.

