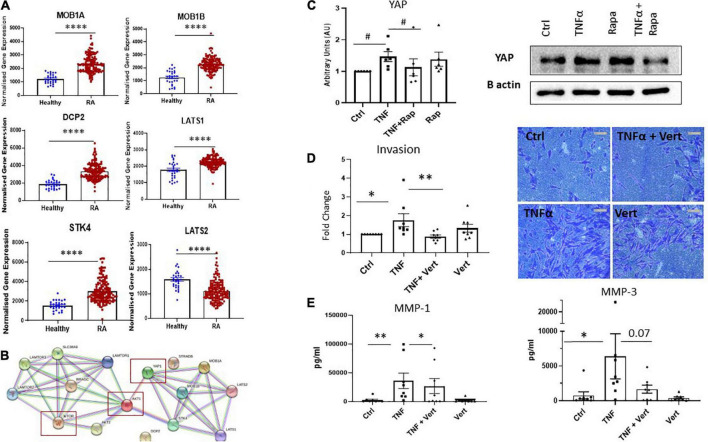
FIGURE 5.
Crosstalk between dysregulated Hippo-YAP and mTOR pathways mediates RASF invasion. (A) Bar graphs demonstrating normalized gene expression of MOB1A, MOB1B, DCP2, LATS1, STK4, and LATS2 in RA patients (n = 152) compared to healthy donors (n = 28). (B) Predicted interactions of dysregulated YAP associated genes with dysregulated genes within mTOR pathway using STRING pathway analysis. (C) Representative western blot images and bar graph showing total YAP expression in RASF (n = 6) treated with TNFα (1 ng/ml) and Rapamycin (100 nM) alone or in combination for 24 h, B-actin was used as a loading control. (D) Representative photomicrographs and accompanying bar graph demonstrating invasion and average number of invading cells in RASF (n = 8) treated with TNFα (1 ng/ml) and Verteporfin (50 nM) alone or in combination for 48 h. (E) Bar graphs showing measured secretion of MMP-1 and MMP-3 from RASF (n = 8) treated with TNFα (1 ng/ml) and Verteporfin (50 nM) alone or in combination for 24 h. Values in graphs expressed as mean ± SEM. Non-parametric unpaired Mann–Whitney t-test used for comparisons between healthy donors and RA patients. Friedman Test with Dunn’s multiple comparison and Wilcoxon signed rank test were utilized for RASF. *p < 0.05, **p < 0.01, ****p < 0.0001, and #p < 0.05 ANOVA.

