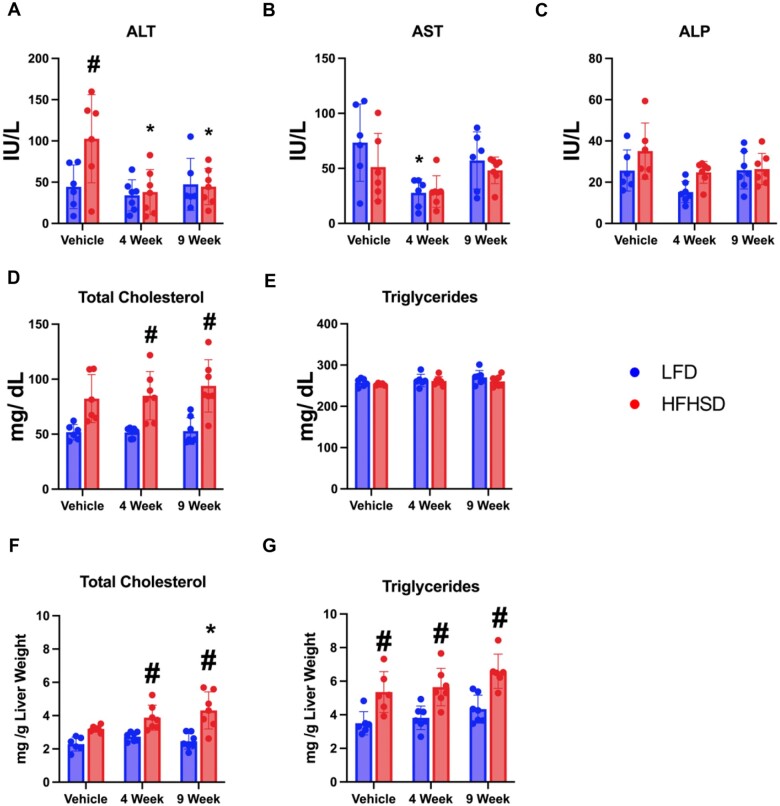
Figure 5.
Serum liver enzyme activities and lipid parameters. A, alanine aminotransferase (ALT), B, aspartate aminotransferase (AST), C, alkaline phosphatase (ALP), D, total cholesterol, E, total bile acids, F, triglyceride levels and hepatic G, total cholesterol, and H, triglycerides. A symbol * placed on each column identifies significant differences compared to vehicle of same diet, # placed on each column identifies significant differences compared to low-fat diet in the same treatment duration. Data are presented as mean ± SD (n = 6–7/group), analyzed using 1-way ANOVA followed by Tukey’s multiple comparisons test. A p < .05 was considered significant.

