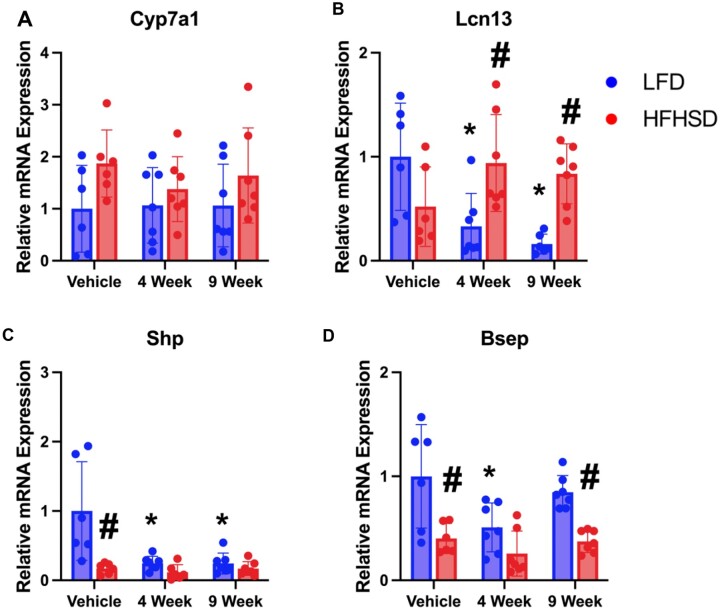
Figure 6.
Relative mRNA quantification of hepatic FXR target genes in NAFLD Study. A, Relative gene expression of hepatic Fxr target genes; A, Cyp7a1, B, Lcn13, C, Shp, and D, Bsep. A symbol * placed on each column identifies significant differences compared to vehicle of same diet, # placed on each column identifies significant differences compared to low-fat diet in the same treatment duration. Data are presented as mean ± SD (n = 6–7/group), analyzed using 1-way ANOVA followed by Tukey’s multiple comparisons test. A p < .05 was considered significant.

