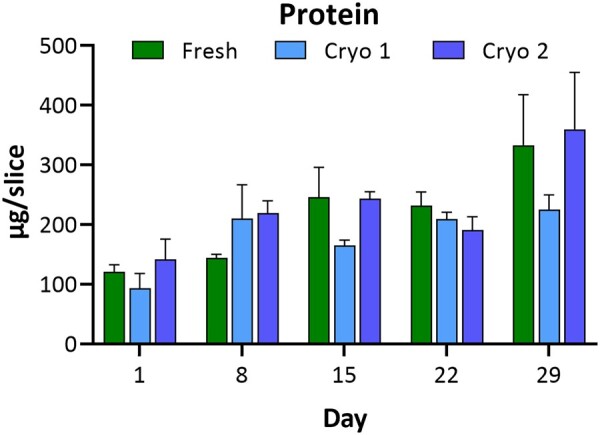
Figure 2.

hPCLS protein content. Comparison of protein content in hPCLS indicates there is no loss of protein over 29 days in culture. Each group (Fresh, Cryo 1, and Cryo 2) exhibits protein content variability at some time points, but no trend in variability is evident for any group, nor is there an apparent distinction between Fresh versus Cryo 1 or Cryo 2. The data are presented as AVE ± SEM, N = 3/group per time point.
