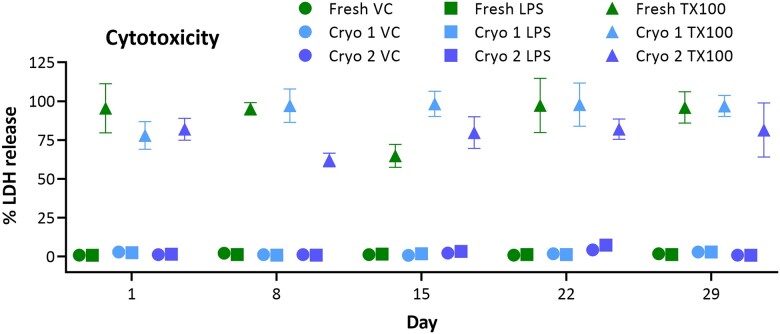
Figure 4.
Irritant-induced cytotoxicity. Comparison of baseline LDH release and irritant-induced cytotoxicity. Neither Fresh, Cryo 1, nor Cryo 2 groups exhibited differential release (in VC and LPS groups) indicating intact and comparable membrane integrity. Treatment of hPCLS with 0.1% TX100 for 24 h elicited similar responses from the same 3 groups and demonstrated equivalent response to irritant challenge. The data are presented as AVE ± SEM, N = 6/group per time point.

