Figure 6.
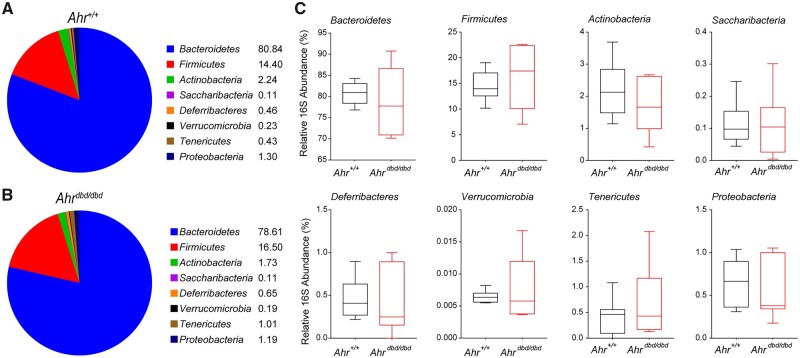
Microbiota at the phylum level were measured before the start of experiment to assess differences between genotypes. A, Average relative amounts of bacterial phyla in healthy Ahr+/+ mice. B, Average relative amounts of bacterial phyla in healthy Ahrdbd/dbd mice. Detailed view of average amounts in (C) Bacteroidetes, Firmicutes, Actinobacteria, Saccharibacteria, Deferribacteres, Verrucomicrobia, Tenericutes, and Proteobacteria.

