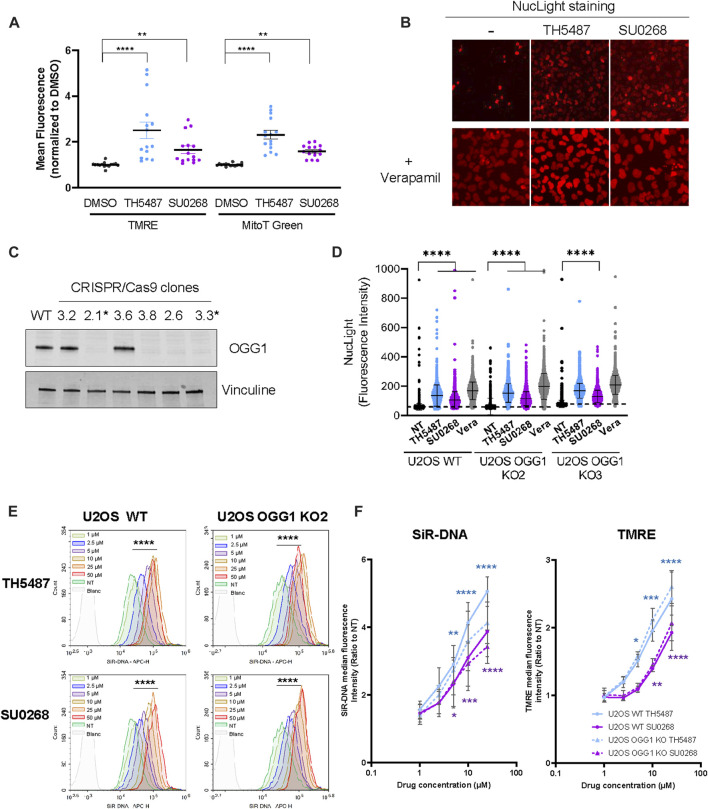
FIGURE 1.
The addition of OGG1 competitive inhibitors TH5487 and SU0268 to the medium results in higher staining with fluorescent dyes. (A) U2OS cells were stained with mitochondrial markers MitoTracker Green and TMRE in the presence of 10 µM of OGG1 inhibitors TH5487 or SU0268. Control cells were stained in DMEM containing DMSO at .1%. Fluorescence was acquired in a plate reader. Fluorescent intensity for each of the channels was normalized to the values measured in cells stained in control cells. Ploted values correspond to at least three technical replicates from four independent experiments. Statistical analysis was performed with a Kruskal-Wallis test. (****)p < 0.0001; (**) p < 0.005. (B) U2OS cells were stained with NucLight in the presence or absence of OGG1 inhibitors TH5487 and SU0268 combined or not with Verapamil (A) and imaged with the Incucyte® Live-Cell Analysis System. (C) OGG1 KO cells generated by CRISPR/Cas9 were validated by Western Blot analysis using an antibody against OGG1. Vinculine was used as a loading control. Clones 2.1 and 3.3 were selected and used in further experiments. (D) U2OS WT and OGG1 KO cells, were stained with NucLight and Picogreen in the presence or absence of OGG1 inhibitors or Verapamil (all used at 10 µM) and imaged with a high-content imaging microscope in both the green and the red channels. Representative images used for the quantification are presented in Figure S1. The graph corresponds to the NucLight fluorescence intensity measured in the nucleus for up to 7000 cells for each condition. One representative experiment out of three is presented. Statistical analysis was performed with a Kruskal-Wallis test. (****)p < 0.0001. (E) U2OS WT and OGG1 KO cells were stained with SiR-DNA in the presence of different concentrations of TH5487 and SU0268 (1, 2.5, 5, 10, 25 or 50 µM) and analysed by flow-cytometry. Results from a representative experiment out of three are presented. The fluorescence distributions of cells stained in the presence of different concentration of TH5487 or SU0268 were compared to control cells on FlowJo using a chi-squared test (****) p-value < 0.001). (F) U2OS WT and OGG1 KO cells (clone 2.1) were stained with SiR-DNA or TMRE in the presence of different concentrations of TH5487 and SU0268 (1, 2.5, 5, 10, 25 or 50 µM) and analysed by flow-cytometry. The median of at least three independent experiments is shown. Statistical analysis was performed with Ordinary one-way ANOVA (*)p < 0.05; (**)p < 0.01; (***)p < 0.001; (****)p < 0.0001.

