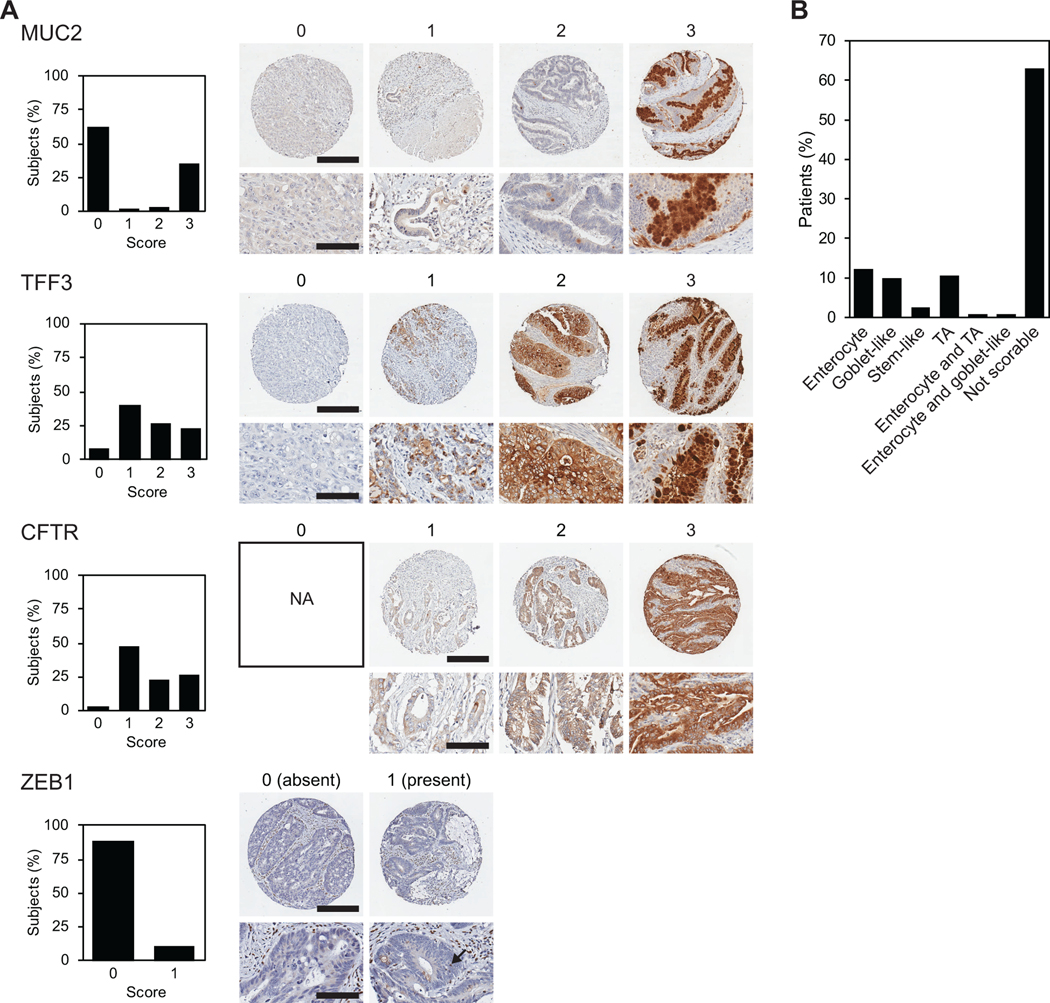
Figure 1. Early immunohistochemistry (IHC)-based classifiers of colorectal carcinomas (CRC).
(A) CRC tissue microarray (CRC TMA) was stained for four previously established IHC classifiers (MUC2, TFF3, CFTR, and ZEB1). Qualitative scoring of epithelial cells was performed using a tiered system for MUC2, TFF3 and CFTR (0, no staining; 1, low intensity; 2, moderate intensity; and 3, high intensity). ZEB1 was scored based on the presence or absence of epithelial cell staining. Representative images of each score are shown on the right, unless the score was not observed (NA, not applicable). On the left, graphs show the percent of cancers for each score tier for MUC2, TFF3, CFTR, and for the presence/absence of ZEB1. For whole core images, scale bar represents 300 μm. For magnified images, scale bar represents 100 μm. (B) The classification of the cancers based on IHC classifiers in (A).

