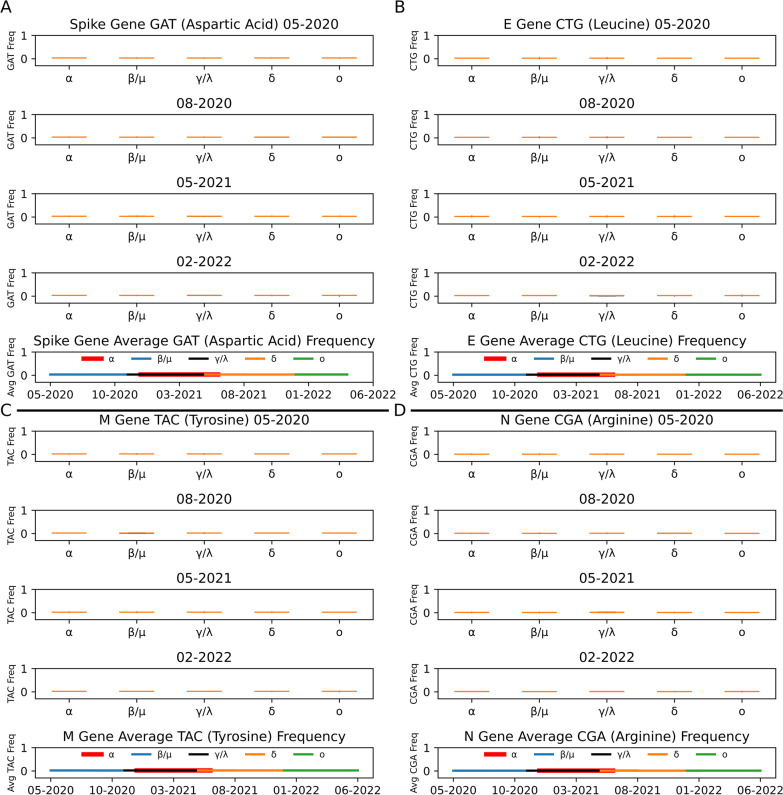
Fig. 3.
Codon Usage of Structural Genes Remains Stable Between Clades and Over Time. Codons highlighted here were selected based on greatest number of significant differences between December 2019 and July 2022 (Additional file 7: Table S7). Clades are represented by their Greek letter and corresponding color for line graphs: Alpha—α (red), Beta/Mu—β/μ (blue), Gamma/Lambda—γ/λ (black), Delta—δ (orange), and Omicron—ο (green). Within each box plot, orange bars represent the median codon frequency of each clade distribution, red dots represent outliers, and black boxes represent the first and third quartiles (often hidden behind the orange median bar). A Spike gene GAT (aspartic acid) frequency distributions (selected months) (box plots) and the average GAT frequency over time (line graph). B E gene CTG (leucine) frequency distributions (selected months) and average CTG over time. C M gene TAC (tyrosine) frequency distributions (selected months) and average TAC over time. D N gene CGA (arginine) frequency distributions (selected months) and average CGA over time. All line graphs utilized the bold regions of the Table 1 clade distributions

