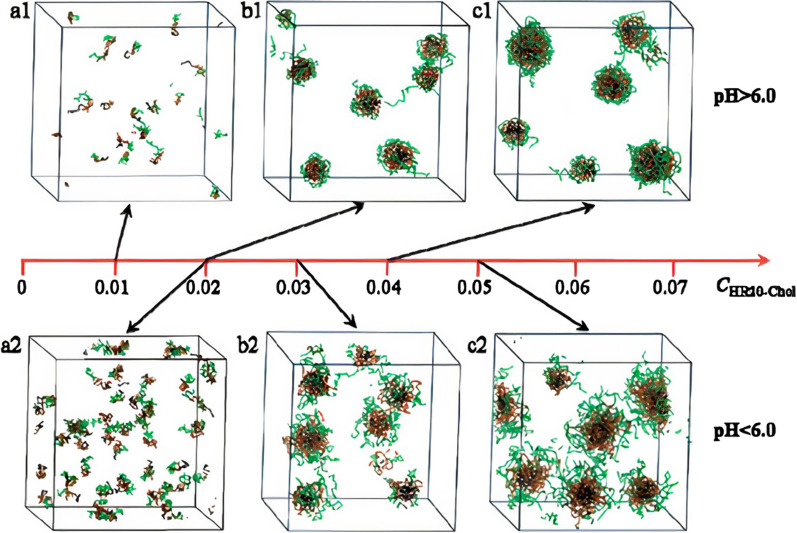
Fig. 18.
A Dissipative Particle Dynamics (DPD)-based investigation on the microstructures of micelles (HR20-Chol) at different pH levels of the aqueous solution. a1, b1, and c1 represent that cases where pH > 6, while pH < 6 for the cases shown in a2, b2, and c2. Line color legend: Green = Arginine; Brown = Histidine, and Black = Cholesterol. The water molecules are omitted in the figure for clarity. Reprinted with permission from ref. [303].
Copyright 2010 American Chemical Society

