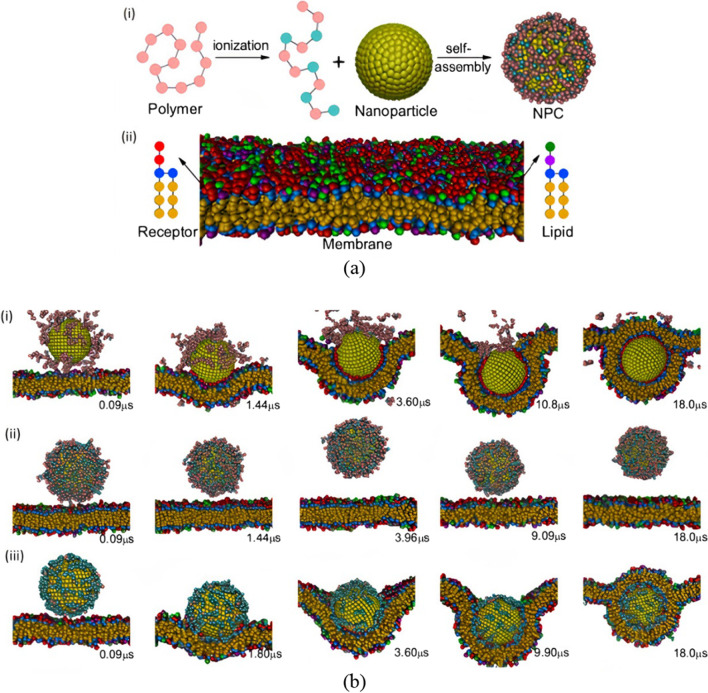
Fig. 19.
a The details of NPC (Nanoparticle-Polymer Complex). a (i) shows the assembly of pH-sensitive polymer on the nanoparticle surface. a (ii) represents the membrane details with lipids and receptors. Schematic illustration of the models in the simulations in which the nanoparticle-polymers complex is shown along with the membranes and architectures of receptors and lipids. b Time evolution of NPC endocytosis for three cases of pH. In b (i) and b (iii), the pH values are lower and higher than the polymer's pKa, respectively. Consequently, the membrane fully engulfs the NP. In contrast, in b (ii), the pH value is equal to polymer’s pKa. Therefore, the endocytosis is blocked. The green, purple, and blue beads correspond to the membrane lipid heads carrying a charge of + e, − e, neutral, respectively. Lipid tails and receptor heads are shown as orange and red beads, respectively. Moreover, the nanoparticles are represented by yellow beads and the polymer beads are depicted in cyan (carrying − e charge) and pink colored beads. Reprinted with permission from ref. [313] (Open Access)

