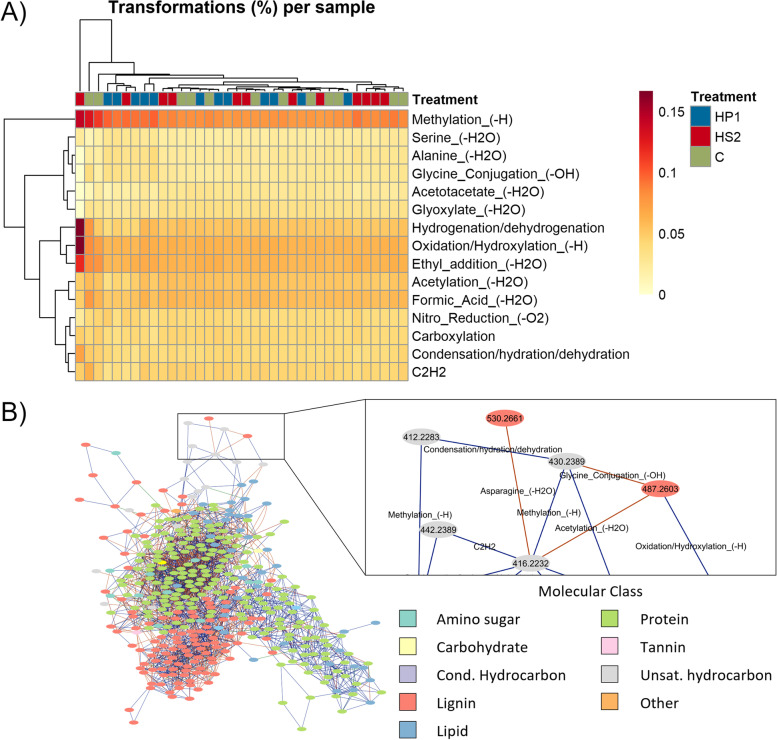
Fig. 3.
Mass-based transformation network analysis of the bacterium-phage data set. A Heatmap with the top 15 more abundant transformations among all the samples converted into a percentage of the total number of transformations in each sample. B Molecular network for the sample P_rich_C_T30_R3. Like most of the other samples, the transformation network showed a cluster of lignin-like metabolites interacting with a cluster of protein-like metabolites. The zoomed panel at the left shows that the transformation networks have the masses of each sample as nodes, while the edges between those nodes represent the transformations

