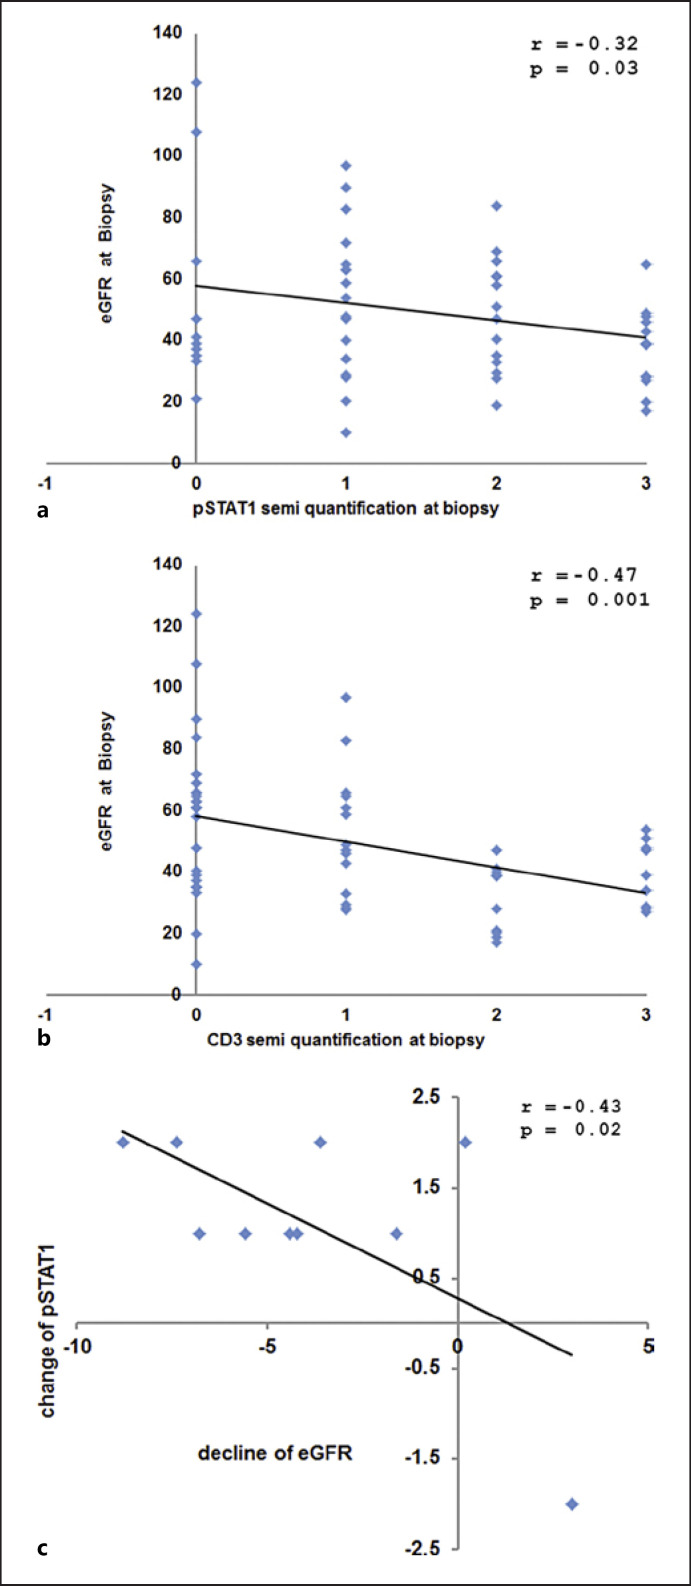
Fig. 2.
Correlation analysis between pathology and clinical markers. a eGFR at time of biopsy plotted against pSTAT1 semi-quantification at biopsy. b eGFR at time of biopsy plotted against CD3 semi-quantification at biopsy. c Change of pSTAT1 semi-quantification against change in eGFR per year from Biopsy 1 to Biopsy 2.

