

Abstract
T cells in systemic lupus erythematosus (SLE) exhibit multiple metabolic abnormalities. Excess iron can impair mitochondria and may contribute to SLE. To gain insights into this potential role of iron in SLE, we performed a CRISPR screen of iron handling genes on T cells. Transferrin receptor (CD71) was identified as differentially critical for TH1 and inhibitory for induced regulatory T cells (iTregs). Activated T cells induced CD71 and iron uptake, which was exaggerated in SLE-prone T cells. Cell surface CD71 was enhanced in SLE-prone T cells by increased endosomal recycling. Blocking CD71 reduced intracellular iron and mTORC1 signaling, which inhibited TH1 and TH17 cells yet enhanced iTregs. In vivo treatment reduced kidney pathology and increased CD4 T cell production of IL-10 in SLE-prone mice. Disease severity correlated with CD71 expression on TH17 cells from patients with SLE, and blocking CD71 in vitro enhanced IL-10 secretion. T cell iron uptake via CD71 thus contributes to T cell dysfunction and can be targeted to limit SLE-associated pathology.
INTRODUCTION
Systemic lupus erythematosus (SLE) is a heterogeneous autoimmune disease that affects millions of people worldwide. Treatment options typically focus on broadly immunosuppressive drugs or B cell–targeting antibodies, although patients with SLE also exhibit an assortment of T cell dysfunctions. These include multiple defects to mitochondria, which are hyperpolarized with elevated reactive oxygen species (ROS) and low adenosine 5′-triphosphate (ATP) production (1, 2). In addition, T cells in SLE can have high metabolic activity (3, 4), an expansion of pathogenic T helper 1 (TH1)–like TH17 (TH1*) cells (5, 6), and reduced regulatory T cell (Treg) suppressive capacity. T cell subsets, including TH1, TH17, and Tregs, each have characteristic metabolic phenotypes and requirements that offer metabolic targets to manipulate these T cell populations (7–9). Given these distinct dependencies, metabolic targeting is a strategy of interest to treat T cells in the setting of SLE (10–13), and simultaneous inhibition of glycolysis and mitochondrial function reduced T cell–mediated inflammation in two mouse models of lupus (14). In addition to these broad-based approaches, targeting micronutrients, such as iron, may directly affect both cellular metabolism and mitochondrial ROS (mitoROS) (15). These pathways, however, remain poorly understood in SLE.
Iron metabolism in SLE is dysregulated in multiple ways. In the kidney, iron in the proximal tubules drives damage by accumulation of iron-catalyzed lipid hyperperoxides (16), and iron accumulation is associated with nephritis. Administration of hepcidin to SLE-prone mice (17) reduced renal iron accumulation and diminished proinflammatory cytokine production from macrophages in the kidney (18). In addition, CD4 T cells were decreased, suggesting that rewiring systemic iron metabolism may influence T cell function. Many patients with SLE have low levels of serum iron (19) and may be considered anemic (20). However, two clinical studies revealed that CD4 T cells from patients with SLE contained higher levels of intracellular iron than healthy control T cells (21, 22). Mechanisms by which iron may be dysregulated and potentially contribute to disease driven by T cells, however, have been poorly understood.
Iron is required for many cellular functions, but excess unbound labile iron can induce cellular damage via oxidative stress, mitochondrial damage, and ferroptosis. The transferrin receptor (CD71) is the primary iron receptor for immune cells and binds to transferrin-bound iron to facilitate internalization of the CD71-transferrin-iron complex. Iron flux and CD71 expression have been shown to be important for T cell activation because missense mutations in the gene for CD71, TFRC, result in combined immunodeficiency (23) with defective T cell proliferation (24). Low serum iron conditions can also impede the primary CD8 T cell response to vaccinations (25) and TH1 responses (26). Regulation of iron metabolism may also differ among T cell subsets (27), because TH1 cells were reported to be highly sensitive to iron depletion (28), and CD71 blockade inhibited TH17 differentiation by increasing interleukin-2 (IL-2) expression and reducing recruitment of retinoic acid receptor (RAR)–related orphan receptor (RORγt) to the IL17a locus (29). In addition, elevated iron in SLE T cells was linked to epigenetic changes that promoted pathogenic T follicular helper (TFH) differentiation (22). However, the effects of CD71 blockade in the setting of SLE T cells, which are inherently dysregulated, have not been tested as an in vivo therapeutic strategy to correct pathogenic TH17 cells (6, 30). In addition, cellular iron regulation in Tregs remains poorly characterized.
Here, we examined iron regulation in SLE-prone mice and patient samples. We show that SLE T cells have increased cell surface expression and altered trafficking of CD71, which leads to excess iron levels that impair normal mitochondrial physiology, mammalian target of rapamycin complex 1 (mTORC1) signaling, and differentiation. Blocking CD71 with an antibody normalized T cell activation, IL-2 production, mitochondrial ATP, and metabolism in SLE T cells. SLE-prone mice with preestablished autoimmunity were treated with anti-CD71 in vivo and demonstrated markedly less disease severity and rewiring of T cell populations that produced more anti-inflammatory IL-10 and increased expansion of Tregs. CD4 T cell expression of CD71 was necessary to drive lupus-like disease in a transfer model of graft-versus-host disease. Last, CD71 levels on TH17 cells from patients with SLE correlated with disease severity. These findings support a potential strategy to normalize T cell metabolism and function while reducing autoimmune pathology in SLE by suppressing T cell iron uptake.
RESULTS
CD71 is conditionally essential for effector T cells but suppresses iTregs
Iron metabolism may offer novel therapeutic targets with the potential to regulate T cell differentiation and mitigate mitochondrial oxidative stress; unbiased approaches have not been used to establish the essential iron regulatory genes in T cells. We therefore designed a custom pooled library of CRISPR-Cas9 guide RNAs (gRNAs) targeting genes in iron metabolism (table S1) to determine genes that are important for T cell differentiation. Naïve T cells from Cas9 transgenic mice were retrovirally transduced to express the pool of gRNAs, and cells were differentiated into TH1 cells and iTregs in physiologically relevant human plasma–like medium (HPLM). gRNA frequencies were determined by sequencing, and guide frequencies in the resultant populations were compared with the starting pool to establish whether a given gene deletion reduced or increased T cell fitness and accumulation. CRISPR disruption of most genes had a modest or no effect, but deletion of Slc25a37 (mitoferrin-1) and Tfrc (transferrin receptor, CD71) was detrimental and led to fitness disadvantages for TH1 cells (Fig. 1A). Conversely, deletion of Tfrc provided a strong fitness advantage to iTregs. TH1 cultures expressed higher levels of CD71 than iTreg cultures (Fig. 1B) and contained more intracellular iron (Fig. 1C). Tfrc thus conditionally affects T cell subsets and is essential for inflammatory T cells.
Fig. 1. Transferrin receptor is conditionally essential for effector T cells and iTregs.
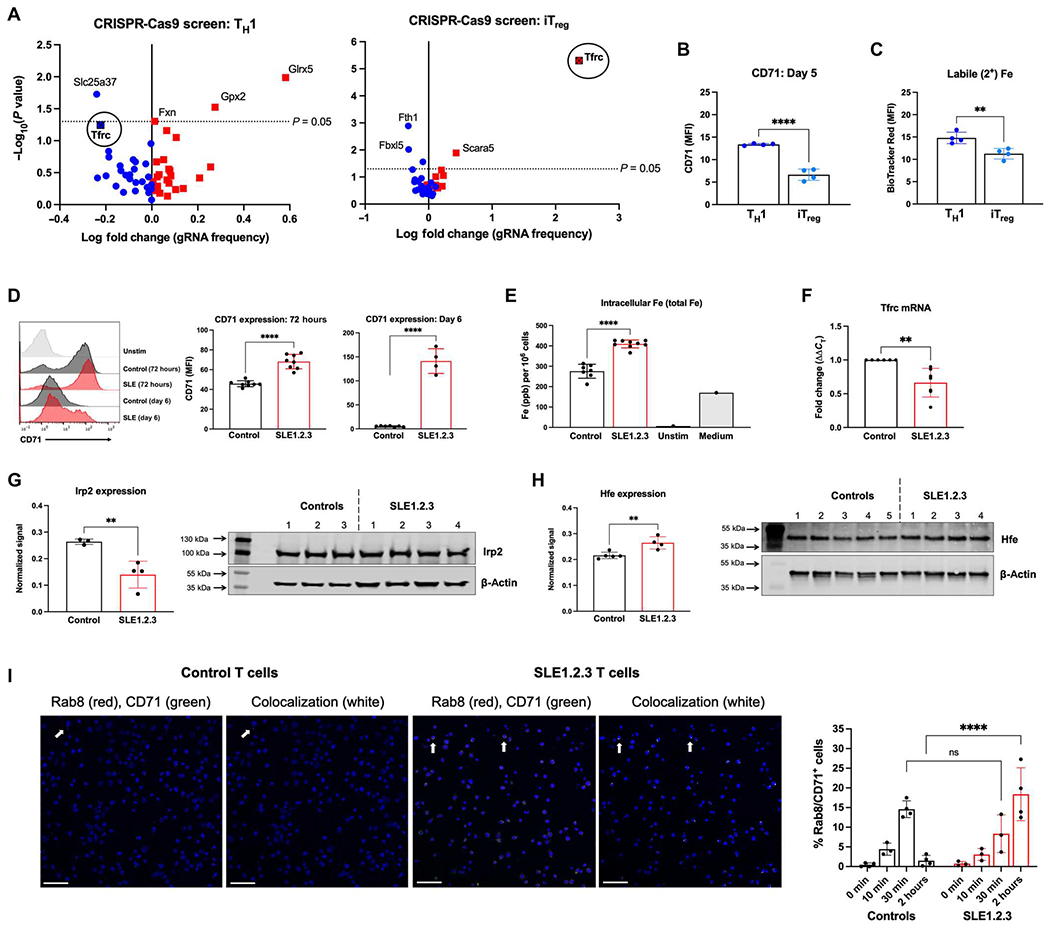
(A) Naïve CD4 T cells from Cas9-transgenic mice were stimulated and skewed into TH1 (left) or iTreg (right) cells. Cells were transduced with a retroviral library of gRNAs specific for genes in iron metabolism or nontargeting controls. MAGeCK analysis was used to determine gRNA depletion (blue) and enrichment (red) in T cell cultures over 7 days. Results are representative of two independent screens. (B) CD71 expression at 5 days after differentiation of activated TH1 and iTreg cultures. (C) Intracellular ferrous iron in TH1 cells and iTregs measured by BioTracker iron staining. (D) CD71 expression at 72 hours and 6 days after activation with a representative plot (left). (E) T cell pellets from 72 hours after activation were subjected to ICP-MS to determine total (2+ and 3+) intracellular iron concentrations. “Unstim” represents T cells that were left unstimulated, and “Media” is a control for iron content in the cell culture medium only. ppb, parts per billion. (F) Tfrc mRNA was quantified in activated T cells by qRT-PCR. (G) Irp2 protein levels were quantified by immunoblot in activated CD4 T cells and normalized to the actin loading control. (H) Whole-cell lysates from ex vivo purified CD4 T cells were examined for Hfe expression by immunoblot. (I) Activated CD4 T cells from control or SLE1.2.3 mice were treated with transferrin protein for 0, 10 min, 30 min, or 2 hours to stimulate CD71 endosomal trafficking. Confocal microscopy was used to quantify the percentage of cells that contained CD71+ recycling endosomes by Rab8 colocalization with CD71 (right). Each data point is from an individual biological replicate where data from three technical replicates were averaged. Representative images from ×20 magnification at the 2-hour time point are shown. Scale bars, 50 μm. (B to H) Student’s unpaired two-tailed t test. (I) Two-way ANOVA. ns, not significant.
Iron metabolism is dysregulated in T cells from patients with SLE
Iron metabolism in immune cells is subject to tight regulation through systemic and cellular mechanisms to support multiple cellular functions and oxidative stress (31). Given reported metabolic defects in SLE T cells, we determined whether dysregulated iron handling was apparent in patients with SLE in published RNA sequencing (32) and human genome array datasets (33, 34). In both SLE total peripheral blood mononuclear cells (PBMCs) and purified CD4 T cells, expression of TFRC was significantly higher in patients with SLE than healthy individuals (fig. S1, A and B). SLC11A2, which encodes for the divalent metal transporter 1, was increased in PBMCs, but not in CD4 T cells. Six-transmembrane epithelial antigen of prostate 3 (STEAP3) expression, an endosomal ferrireductase, was modestly increased in CD4 T cells from patients with SLE but not PBMC samples. Hemochromatosis (HFE) (35), a regulator of iron homeostasis and CD71 iron uptake, was significantly increased in both PBMC and CD4 T cell samples from patients with SLE. HFE can bind to CD71 and reduce its affinity for transferrin-bound iron but may also enhance iron uptake when associated with (β2-microglobulin by promoting endosomal recycling of CD71 to the plasma membrane (35). Concentrations of HFE in serum were significantly elevated in patients with SLE compared with healthy controls (fig. S1C). Collectively, these studies suggest that CD71 is dysregulated and may contribute to the elevated iron concentrations and dysfunction previously measured in T cells from patients with SLE (21, 22).
T cells from lupus-prone mice have altered activation and kinetics of CD71 induction
T cell receptor activation is often impaired in T cells from patients with SLE (36, 37), and iron uptake is associated with T cell activation. To better understand the regulation of iron metabolism in SLE, we examined the triple congenic mouse model of lupus-prone mice (referred to as SLE1.2.3), which closely mimics human disease (38, 39). Naïve CD4 T cells were isolated from female SLE1.2.3 mice or healthy age-matched control mice and stimulated to measure activation over time. T cells from SLE1.2.3 mice induced significantly lower levels of activation markers CD25 and CD69, and down-regulation of CD62L was delayed (fig. S2A). In contrast, CD44 was significantly higher in activated SLE1.2.3 T cells compared with controls (fig. S2A), as has been reported in T cells from patients with SLE (40).
Cell surface CD71, also considered an activation marker of T cells, was significantly higher in SLE T cells than controls and remained elevated long after initial stimulation (Fig. 1D). Increased and prolonged expression was associated with elevated intracellular iron concentrations in SLE1.2.3 T cells (Fig. 1E). Therefore, both the elevated intracellular iron and altered T cell activation phenotypes and CD71 expression were altered in consistent fashions between the SLE1.2.3 mouse model and phenotypes demonstrated by T cells from patients with SLE (21). Although protein levels of CD71 were higher in SLE1.2.3 T cells, transcripts of Tfrc were significantly lower than controls (Fig. 1F), suggesting posttranscriptional regulation. Translation of Tfrc is known to be regulated by the RNA binding protein iron-regulatory protein 2 (Irp2). Irp2 is subject to proteasomal degradation in the presence of iron, but in low iron states, the protein is stabilized, binds to iron-responsive elements (IREs) in Tfrc mRNAs, and stabilizes the transcript (41). Consistent with higher concentrations of iron in SLE1.2.3 T cells (Fig. 1E), Irp2 protein was reduced when normalized to (β-actin (Fig. 1G). Hfe expression was increased in SLE1.2.3 T cells (Fig. 1H), which may influence the recycling rate of CD71 (35).
To investigate endosomal recycling of CD71 in SLE1.2.3 T cells, we stimulated CD71 internalization in activated T cells with transferrin protein. Using Ras-related protein Rab8 as a marker of recycling endosomes (42), we quantified colocalization of CD71 and Rab8 at each time point (Fig. 1I). Control T cells demonstrated peak colocalization after 30 min of transferrin stimulation and returned to baseline levels by 2 hours. By contrast, SLE1.2.3 T cells increased colocalization over time, with the highest signal at 2 hours that was significantly higher than that of control T cells. These data suggest that altered or increased recycling contributes to the increased surface levels of CD71 in SLE1.2.3 T cells.
CD71 blockade reduces intracellular iron and normalizes SLE T cell activation in vitro
Anti-CD71 antibodies have been reported to bind CD71 to block association with transferrin-iron complexes and stimulate receptor internalization without iron uptake (43, 44). Consistent with receptor blockade and/or internalization, cell surface CD71 expression decreased as observed by flow cytometry in activated T cells treated with CD71-blocking antibody compared with the isotype control (fig. S3A). Because flow cytometric detection of cell surface CD71 could have been hindered by the presence of the CD71-blocking antibody, however, internalization was specifically tested by treatment of activated T cells with anti-CD71 or the isotype control antibody for 1 hour, followed by a secondary antibody. T cells were either permeabilized or nonpermeabilized before adding the secondary, allowing the measurement of internalized versus cell surface–associated blocking antibody. There was significant internalization of the receptor/anti-CD71 complex (fig. S3B). This correlated with a significant decrease in intracellular labile iron, confirming the role of the blocking antibody in reducing intracellular iron loads (fig. S3C).
Because CD71 expression and iron flux are important for T cell activation, we tested whether anti-CD71 would prevent T cell activation. CD69 up-regulation was restored to SLE1.2.3 T cells treated with anti-CD71, whereas control T cells were unaffected (Fig. 2A). Conversely, CD44 overexpression in SLE1.2.3 T cells was reduced to control levels by anti-CD71 treatments (Fig. 2B). T cells in patients with SLE have a well-documented deficiency in IL-2 production (45). The percentage of IL-2–producing T cells was increased in SLE1.2.3 T cells activated with anti-CD71 but not control T cells (Fig. 2C). Furthermore, IL-2 transcription was significantly boosted in SLE1.2.3 T cells and modestly increased in control T cells (Fig. 2D). Overall, IL-2 secretion was defective in SLE1.2.3 T cells compared with controls but significantly improved by anti-CD71 on a per-cell basis (Fig. 2E). Together, these data show that targeting CD71 correlates with lower intracellular iron and can normalize altered T cell activation phenotypes demonstrated by SLE T cells.
Fig. 2. CD71 blockade normalizes T cell activation and mTORC1 in SLE1.2.3 T cells.
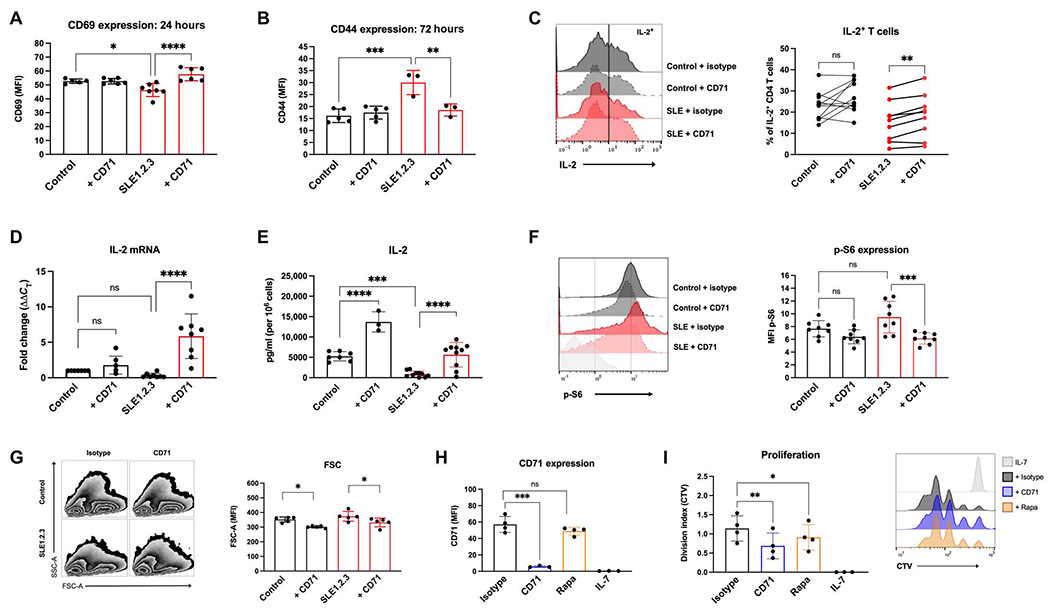
(A) CD69 expression was determined by flow cytometry 24 hours after activation in T cell cultures. (B) CD44 expression was determined by flow cytometry 72 hours after activation. (C) T cell cultures were restimulated on day 5 after activation with PMA/ionomycin to quantify the percentage of IL-2+ CD4 T cells. (D) IL-2 mRNA was quantified on day 4 of activation by qRT-PCR. (E) Cell culture supernatants were collected on day 4 of activation, and IL-2 concentrations were determined by ELISA. Values were then normalized to viable cell counts. (F) T cell cultures on day 5 of stimulation were analyzed by intracellular flow cytometry for p-S6. Results are from two independent experiments. (G) Forward scatter (FSC) and side scatter (SSC) were measured in T cell cultures. (H) CD4 T cells were activated for 24 hours and then treated with antibodies or nM rapamycin (rapa) for 2 days. IL-7 cells were left unstimulated as a control group. CD71 was measured by flow cytometry, and (I) CellTrace Violet (CTV) staining was used to calculate the division index. (A, B, and D to I) One-way ANOVA with Sidak’s multiple comparisons test. (C) Paired ANOVA with Sidak’s multiple comparisons test. Results are from three experiments combined.
CD71 blockade restores mTORC1 signaling and mitochondrial function in SLE-prone T cells
To determine the mechanism by which targeting CD71 targeting may rescue functional abnormalities in SLE T cells, we tested CD71 regulation of mTORC1. High levels of mTORC1 have been reported in SLE T cells (46, 47) and can be detrimental to Tregs. mTORC1 integrates the status of multiple cell nutrient and metabolic conditions with cell signaling to phosphorylate targets such as p70S6 kinase and promote anabolic metabolism. mTORC1 activity as indicated by phospho-S6 (p-S6) trended higher in SLE1.2.3 T cells and was significantly reversed with anti-CD71 (Fig. 2F). These findings are consistent with other results that iron chelation suppresses mTORC1 activation (48, 49). mTORC1 broadly regulates anabolic metabolism, so the effects of CD71 blockade reduced T cell size, which was normalized in SLE1.2.3 T cells with anti-CD71 when measured by flow cytometric forward light scatter (Fig. 2G). To test whether mTORC1 signaling regulates CD71 expression, T cells were activated for 24 hours and then treated with rapamycin to inhibit mTORC1. mTORC1 inhibition did not significantly affect CD71 expression (Fig. 2H), whereas both anti-CD71 and rapamycin significantly lowered cell proliferation (Fig. 2I). Therefore, CD71 and iron metabolism predominately regulates mTORC1 signaling in T cells, although mTORC1 may contribute a minimal role to CD71 expression.
Altered mitochondrial metabolism and low ATP production is a well-documented phenotype of T cells in SLE (50); thus, we investigated the effects of anti-CD71 on mitochondrial function. Mitochondrial matrix protein mass indicated by MitoTracker Green was reduced in SLE1.2.3 T cells relative to control T cells (Fig. 3A). Anti-CD71 treatment resulted in a further decrease in mitochondrial mass in both control and SLE1.2.3 T cells. CD71 blockade also resulted in a large decrease in mitoROS in both control and SLE1.2.3 T cells (Fig. 3B). Therefore, manipulations of iron metabolism affect some mitochondrial features in T cells independently of disease status.
Fig. 3. CD71 blockade restores metabolic and mitochondrial function in SLE1.2.3 T cells.
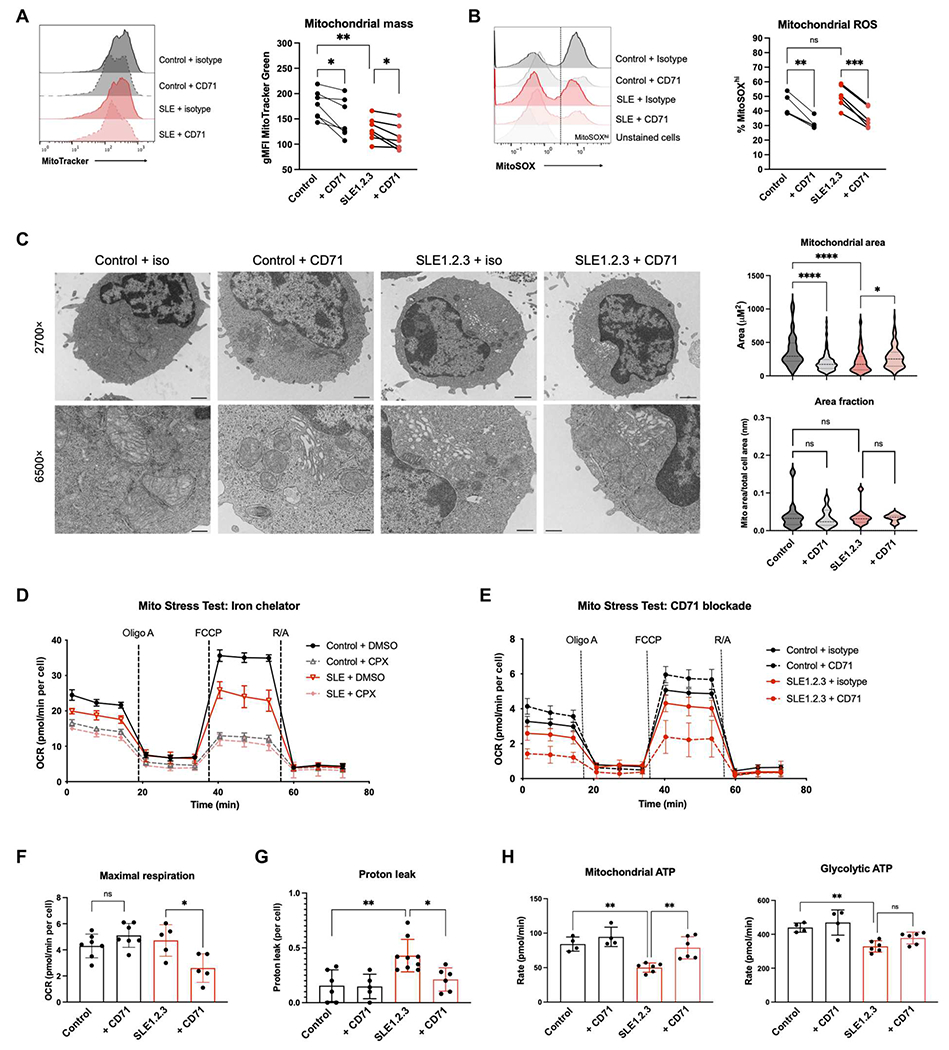
(A and B) MitoTracker Green (A) and MitoSOX Red (B) staining was measured by flow cytometry on day 5 after activation. (C) T cell cultures were processed for EM. A minimum of 100 mitochondria were analyzed in each sample group to quantify mitochondrial area (right). Scale bars, 1 μm (at 2700×) and 400 nm (at 6500×). (D) Extracellular flux analysis on day 5 after activation. Representative oxygen consumption rate (OCR) during a Mito Stress Test is shown. Cells were treated with dimethyl sulfoxide (DMSO) or CPX for 4 hours. (E) Representative Mito Stress Test for T cells activated with isotype control or anti-CD71. Maximal respiration (F) and proton leak (G) were quantified from Mito Stress Test (E). R/A, rotenone and antimycin A. (H) An ATP rate assay was performed with CD4 T cells as activated in (E) to quantify mitochondrial (left) versus glycolytic (right) ATP production. (A, B, and E to H) One-way ANOVA with Sidak’s multiple comparisons test. (C and D) Paired ANOVA.
The ultrastructure of the mitochondria was next analyzed by electron microscopy (EM). Mitochondrial cross-sectional area (referred to hereby as mitochondrial area) was determined by measuring the area of mitochondrial membranes and revealed that SLE1.2.3 T cell mitochondrial size was significantly smaller than controls (Fig. 3C). Anti-CD71 treatment in control cells reduced mitochondrial area but did not change the overall morphology of the mitochondria. In contrast, anti-CD71 treatment of SLE1.2.3 T cells caused a marked change in morphology from small dense mitochondria to larger areas with reduced electron density that was comparable to control T cells. Despite changes in mitochondrial area, the total mitochondrial area fraction of cells was not affected by disease status or treatment type (Fig. 3C) to indicate that the average proportion of the cell that was occupied by mitochondria did not change and only the immediate size of individual mitochondria was distinctly affected. The increase in mitochondrial area in anti-CD71–treated SLE1.2.3 T cells with an invariant area fraction suggests that the cells have fewer but larger and less dense mitochondria, consistent with the observed reduction in MitoTracker staining that detects cardiolipin in mitochondrial membranes.
To test whether anti-CD71 affected mitochondrial respiration in SLE1.2.3 T cells, we conducted extracellular flux analyses. All T cells required some level of iron for mitochondrial function because T cells incubated with the cell-permeable iron chelator ciclopirox (CPX) had decreased basal and maximal mitochondrial respiration regardless of disease status (Fig. 3D). However, respiration of T cells was differentially affected by anti-CD71 in SLE1.2.3 T cells versus controls (Fig. 3E). Whereas control T cells had slightly increased maximal respiration with CD71 blockade, respiration was significantly decreased in SLE1.2.3 T cells (Fig. 3F). SLE1.2.3 T cells had a significantly higher mitochondrial proton leak, a measure of electron transport efficiency across the mitochondrial membrane outside of ATP synthase and mitochondrial quality (51), than control cells (Fig. 3G). Proton leak was restored in SLE1.2.3 T cells, however, to levels of controls by anti-CD71. Anti-CD71 treatments led to a significant boost in ATP production specifically from the mitochondria and not from glycolysis (Fig. 3H). Together, these data demonstrate a morphological and functional effect of CD71 blockade on SLE1.2.3 T cells that improves efficiency of respiration and mitochondrial ATP production.
CD71 differentially affects T cell subsets
CRISPR-Cas9 screening indicated that Tfrc was conditionally essential for TH1 but not iTregs (Fig. 1A). Therefore, we tested whether anti-CD71 exerted distinct impacts on different CD4 T cell subsets. Naïve T cells from control mice were activated with CD71 blockade or an isotype control during differentiation for TH1 and TH17 cells and iTregs. Anti-CD71 treatment led to increased apoptotic cell death in TH1 cultures, consistent with a positive role for CD71 in TH1 cells, but had limited or no effect on iTreg or TH17 cultures (fig. S4A). Mechanistically, this increased apoptosis was associated with extensive DNA damage as indicated by phosphorylation of H2A histone family member X (H2AX), a hallmark of double-stranded breaks (fig. S4B).
Although anti-CD71 treatment did not affect the viability of TH17 cells, anti-CD71 interfered with their differentiation, in agreement with other recent work (29). The percentage of IL-17+ cells was significantly reduced compared with controls (fig. S4C). In contrast to previous studies that found a role for increased IL-2 to suppress TH17 cells, however, only a modest increase in the percentage of IL-2+ cells with anti-CD71 was observed (fig. S4D), suggesting that additional mechanisms exist to inhibit TH17 differentiation during CD71 blockade. Anti-CD71 during activation also interfered with TH17 differentiation of SLE1.2.3 T cells (fig. S4E). TH17 cells treated with the chelator CPX had a further reduction in IL-17 production in both control and SLE1.2.3 T cells. Therefore, both acute iron availability and/or iron loads during early T cell differentiation can regulate IL-17 production in SLE T cells.
T cell differentiation to functional subsets is largely driven by specific cytokines, which could regulate CD71 expression directly. We hypothesized that IL-6 would drive the highest expression of CD71 on activated T cells. To this end, T cells were differentiated in the presence of individual cytokines involved in TH1, TH17, and Treg differentiation with or without transforming growth factor-β (TGF-β). T cells activated in TGF-β alone failed to up-regulate CD71 after activation (fig. S4F). The percentage of CD71+ cells was similar under other conditions, whereas the intensity of CD71 expression was varied (fig. S4F). T cells activated in IL-2 or IL-6 had the highest CD71 intensity but, when combined with TGF-β, expressed less than a third of the amount. CD71 was regulated by cytokines independently of activation status because CD25 expression demonstrated a distinct pattern of regulation from that of CD71 (fig. S4G), with T cells activated with either IL-6 or TGF-β + IL-6 + IL-1β + IL-23 having the highest CD25 intensity. T cell CD71 and CD25 split into two distinct expression trajectories based on the presence or absence of TGF-β (fig. S4H). Cultures without TGF-β had high CD71 and lower CD25 expression, and cultures with TGF-β expressed more CD25 and less CD71.
TH17 cultures were subjected to RNA sequencing to determine whether SLE1.2.3 T cell gene expression profiles promoted enhanced TH17 differentiation and/or iron metabolism. Kyoto Encyclopedia of Genes and Genomes pathway analysis revealed that SLE1.2.3 TH17 cells contained a gene expression profile more enriched for TH17 differentiation and IL-17 signaling than control TH17 T cells (Fig. 4A and tables S2 and S3). TH17 cells from SLE1.2.3 mice were also more pathogenic, as indicated by significant increases in Csf2,Il6, and Ifng, which had a fold change of >165 in SLE1.2.3 T cells. Gene ontology analysis of biological processes performed on significant genes revealed enrichments in both regulation of metal ion transport and divalent metal ion transport pathways (table S4). In addition, the most marked change among all gene expression as determined by DESeq2 analysis was the ferritin light chain, Ftl1 (Padj = 5.2 × 10−111; Fig. 4B). Despite decreased ferritin expression, SLE1.2.3 T cells exhibited large increases in multiple iron handling genes, including Steap3, Slc11a1, and Glrx, an enzyme required for the biogenesis of iron-sulfur clusters. Two iron-binding lipoxygenases involved in fatty acid hydroperoxidase production (Alox5 and Alox15) were also significantly increased in SLE1.2.3 T cells (Fig. 4B). Using a newly compiled gene set of predicted IRE or IRE-like motifs in 3′ untranslated region (3′-UTR) and 5′-UTR (52), we tested whether transcripts had global changes in IREs. SLE1.2.3 TH17 cells exhibited down-regulation in IRE motifs compared with control TH17 cells (table S5). Together, these data suggest that SLE1.2.3 T cells are transcriptionally more primed for TH17 differentiation and pathogenicity, have significant disruptions in key cellular iron handling genes, and suggest an altered transcriptional responsiveness to iron-based regulation by global mRNA IRE representation.
Fig. 4. CD71 blockade differentially affects T cell subsets.
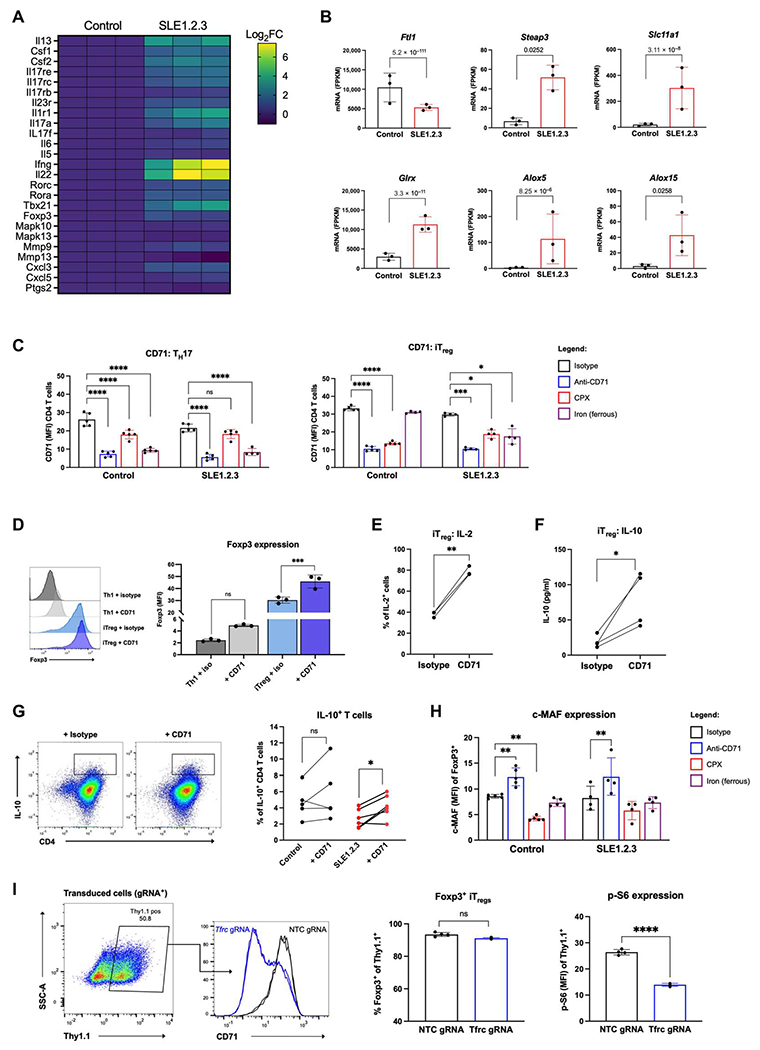
(A) RNA sequencing results of TH17 differentiated cultures from either healthy control or SLE1.2.3 mice. IL-17 signaling and TH17 differentiation gene expression is shown in a heatmap by log2 fold change (Log2FC). Data are normalized to controls. (B) Iron metabolism genes in TH17 cultures from control or SLE1.2.3 samples. P values on plots are the adjusted P values determined by DESeq2 analysis. (C) CD71 expression on day 3 of activation in TH17 cells or iTregs treated with isotype control, anti-CD71, CPX, or iron supplementation. (D) iTreg and TH1 cultures ± CD71 blockade were analyzed for Foxp3 expression on day 5 after activation. (E) iTreg cultures were analyzed for IL-2 production by flow cytometry. (F) Naïve T cells were subjected to iTreg differentiation for 3 days. Supernatants were analyzed for IL-10 by ELISA and normalized to cell number. (G) Naïve CD4 T cells isolated from SLE1.2.3 and control mice. Day 4 cells were restimulated as in (C) to determine the percentage of IL-10+ T cells. (H) c-MAF expression in Foxp3+ iTregs. (I) Naïve T cells from Cas9 transgenic mice were differentiated into iTreg cultures for 2 days and transduced with a gRNA targeting Tfrc or a nontargeting control (NTC). Transduced cells (Thy1.1+) were analyzed for Foxp3 expression (left) and p-S6 (right) by flow cytometry 5 days later. (C, D, and H) Two-way ANOVA with Dunnett’s multiple comparisons test. (G) One-way ANOVA with Sidak’s multiple comparisons test. (I) Paired ANOVA. (E and F) Paired Student’s t test. (I) Unpaired two-tailed Student’s t test. FPKM, fragments per kilobase of transcript per million mapped fragments.
CD71 regulation in response to iron manipulation is distinct between TH17 and iTregs
The effects of anti-CD71 and other cellular iron manipulations were next examined specifically on TH17 cells and iTregs. Because CD71 itself is regulated by iron-responsive proteins during T cell activation (53), we treated T cells with CPX or supplemented cultures with excess iron during differentiation to indirectly test whether iron-dependent regulation of CD71 could be dysregulated in SLE. Control CPX-treated TH17 cells had a decrease in CD71 expression, but CD71 was not significantly affected in SLE1.2.3 T cells (Fig. 4C), suggesting that CD71 regulation may be less sensitive to intracellular iron concentrations in SLE1.2.3 T cells or that iron chelation had a smaller effect due to higher starting concentrations of iron. In both controls and SLE1.2.3 T cells, iron supplementation significantly decreased CD71 expression, in agreement with another study of T cells loaded with excess iron that also down-regulated CD71 (54) potentially through IRP function. iTregs did not exhibit the same down-regulation of CD71 expression with iron supplementation (Fig. 4C). This distinct regulation was unique to control iTregs because iTregs from SLE1.2.3 mice did show a significant decrease in CD71 expression with iron supplementation to further support differential iron regulation in SLE T cells.
The effects of anti-CD71 were next examined specifically on iTregs. Consistent with enhanced iTreg accumulation after CRISPR deletion of Tfrc (Fig. 1A), anti-CD71 significantly increased forkhead box P3 (Foxp3) expression in iTregs compared with the isotype control (Fig. 4D), although the overall percentage of Foxp3+ cells was unaffected. The percentage of iTregs producing IL-2 doubled, and the amount of IL-10 secreted into cell supernatants under iTreg conditions was increased with anti-CD71 treatment (Fig. 4, E and F). Naïve T cells isolated and differentiated into iTregs produced significantly more IL-10 with anti-CD71 treatment (Fig. 4G). This was accompanied by increased musculoaponeurotic fibrosarcoma (c-MAF) expression with anti-CD71, a common feature for IL-10 production in T cells across subsets (Fig. 4H) (55). To genetically test the role of Tfrc, we cloned single gRNAs to target Tfrc or a scramble nontargeting control sequence to delete CD71 during iTreg differentiation (Fig. 4I). Transduced cells expressing CD90.1 (Thy1.1) were analyzed for Foxp3 expression, which did not significantly change with Tfrc deletion, although iTreg culture conditions promoted more than 90% of cells to express Foxp3. mTORC1 activity was significantly decreased by Tfrc deletion in iTregs, as shown by less p-S6 (Fig. 4I). These data show that CD71 blockade can modulate T cell differentiation to suppress effector T cells and boost Foxp3 expression and IL-10 production of iTregs.
CD71 blockade reduces pathology and autoimmunity in SLE1.2.3 mice
On the basis of the ability of CD71 blockade to improve the activation and mitochondrial functions of SLE1.2.3 T cells, we tested whether this treatment could reduce in vivo markers of autoimmunity in lupus-prone mice. To this end, SLE1.2.3 females and age-matched controls were treated with isotype control or anti-CD71 antibody twice a week for 4 weeks (Fig. 5A). SLE1.2.3 mice with preestablished autoimmunity determined by anti–double-stranded DNA (dsDNA) immunoglobulin G (IgG) antibodies at the start of the treatment course were included in the study (Fig. 5B). By the end of the treatment course, anti-dsDNA antibodies in SLE1.2.3 mice treated with anti-CD71 were reduced compared with the isotype control group (Fig. 5C). Antinuclear antibodies (ANAs) and anti-histone antibodies also showed decreased trends (fig. S5, A and B). Splenomegaly was significantly reduced with anti-CD71 treatment (Fig. 5D), but total B cell numbers appeared unaffected (fig. S5C). However, spleens and lymph nodes (LNs) were harvested, and CD4 T cells were isolated, revealing a significant drop in CD4 T cell numbers in anti-CD71–treated mice (Fig. 5E). Treatment was well tolerated, and no signs of anemia were detected by complete blood count analysis (fig. S5, D to F). Analysis of activation markers immediately ex vivo showed that SLE1.2.3 T cells exhibited much higher CD69 expression, which was not affected by the anti-CD71 treatments (fig. S5G). There was, however, a rescue in the intensity of CD44 expression of the anti-CD71–treated group in SLE1.2.3 T cells (Fig. 5F).
Fig. 5. CD71 blockade reduces autoimmunity and pathology in SLE1.2.3 mice.
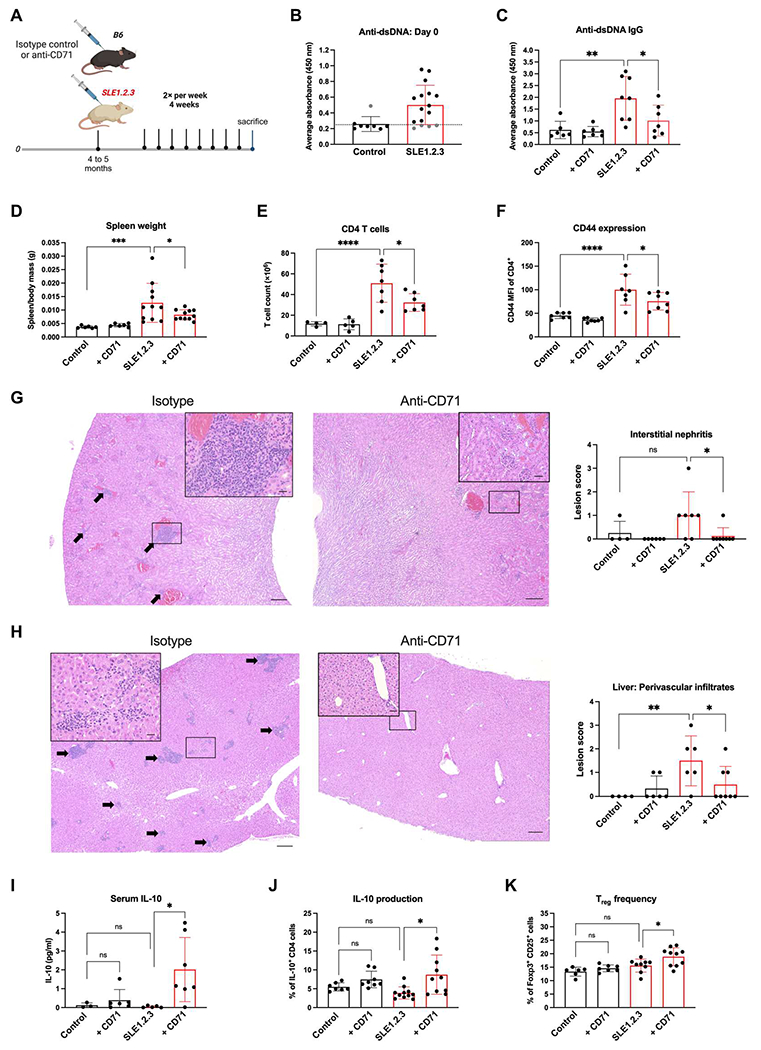
(A) SLE1.2.3 mice or age-matched B6 controls were treated twice per week with an isotype control or anti-CD71 for 4 weeks, n = 4. (B) Anti-dsDNA antibodies were measured in serum before the treatment regimen. The dotted line represents the cutoff value for inclusion criteria. (C) End point serum levels of anti-dsDNA Ig antibodies. (D) Splenomegaly was measured by spleen–to–body mass ratio at study end point. (E) CD4 T cells were isolated from the spleen and LNs by negative selection, and cell counts were determined by automated cell counter. (F) CD4 T cells as described in (E) were stained for CD44 and examined by flow cytometry. (G) and (H) Pathological assessment of inflammation in the kidney (G) and liver (H) was scored semiquantitatively from H&E-stained tissue sections. Arrows indicate infiltrates of lymphocytes and plasma cells. Scale bars, 200 μm (large) and 20 μm (insets). (I) End point sera were measured for IL-10 concentrations. Assay limit of detection was 0.000531. (J) CD4 T cells from spleens and LNs were stimulated with PMA/ionomycin. IL-10+ CD4 T cells were quantified by flow cytometry. (K) The percentage of CD25+ Foxp3+ cells within total CD4 T cells was determined by flow cytometry at the study end point. All experiments were n = 3. One-way ANOVA with Sidak’s multiple comparisons test was used to determine significance of all plots.
Kidneys and livers were next analyzed to assess SLE-associated pathology and determine whether CD71 blockade reduced tissue damage. Histopathologic assessment of inflammation was blindly scored with a semiquantitative inflammation scale in stained tissue sections (56). In the kidney, interstitial nephritis and glomerular loop thickening were evident in the kidneys of SLE1.2.3 mice that received isotype control antibody (Fig. 5G). These lesions were significantly reduced with anti-CD71 treatments. SLE1.2.3 mice also exhibited periportal infiltrates of lymphocytes and plasma cells in the liver (Fig. 5H) that were greatly reduced with anti-CD71 treatment.
Consistent with increased IL-10 secretion from iTreg cultures treated with anti-CD71 (Fig. 4H), there was a large increase of IL-10 in the sera of SLEl.2.3 mice with anti-CD71 treatments (Fig. 5I). Furthermore, the percentage of CD4 T cells producing IL-10 was significantly increased (Fig. 5J), suggesting that CD71 targeting may rewire CD4 T cells in vivo to secrete IL-10. We hypothesized that Tregs may be a source of the IL-10 because our CRISPR screen and CD71 blockade in vitro were beneficial to iTreg cultures (Fig. 1A). In agreement with this, natural Treg frequency increased in SLEl.2.3 mice treated with anti-CD71 (Fig. 5K), but no changes in the frequency of T follicular regulatory (Tfr) cells were observed (fig. S5H). TFH cells were expanded in SLE1.2.3 mice, and anti-CD71 treatments boosted TFH frequency in control mice but not SLE1.2.3 mice (fig. S5I). Together, these data show that anti-CD71 treatments were well tolerated in vivo, reduced disease pathology, and supported Tregs.
CD71 expression on T cells is required to drive autoimmunity in an inducible model of SLE
Although anti-CD71 treatments reduced autoimmunity in SLE1.2.3 mice, CD71 expression is not limited to T cells, and therefore, antibody treatments could have also affected other cell types. To address this, we used CD4cre;Tfrcfl/fl mice in the inducible bm12 model of SLE. Splenocytes from a C57BL/6 background are transferred into congenic bm12 recipient mice, which have a three–amino acid polymorphism in H2-Ab1, and autoimmunity develops within 14 days (57). We hypothesized that Cre+ recipients would not develop autoimmunity if CD71 expression on T cells is necessary for autoreactive T cells in SLE. By the 14-day end point, only Cre− recipients developed a significant detection of anti-dsDNA antibodies (Fig. 6A). By day 8 after transfer, a significant expansion of both TFH and germinal center (GC) B cells could be detected in peripheral blood compared with Cre+ recipients or sham control mice (Fig. 6B).
Fig. 6. CD71 expression on T cells is required to drive SLE.
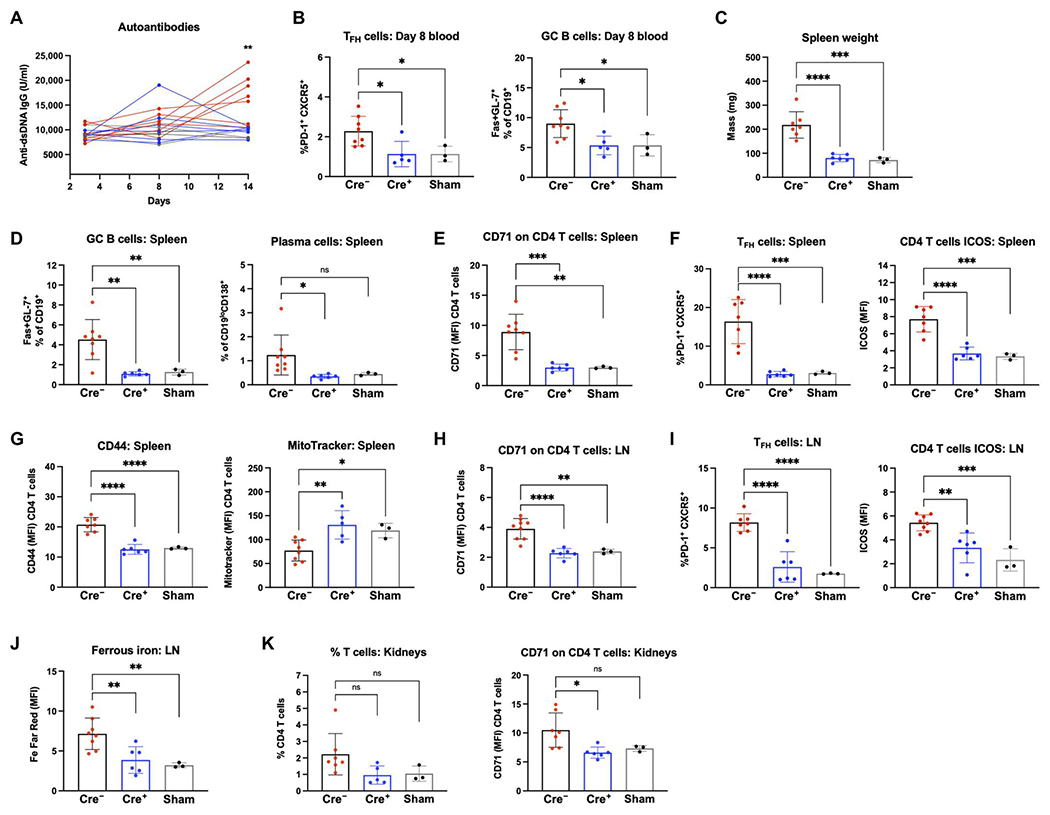
Splenocytes from CD4−Cre− Tfrcfl/fl or Cre+ Tfrcfl/fl mice were transferred into bm12 recipient mice to induce SLE. Sham mice received a control PBS injection with no cells. (A) Sera from days 3, 8, and 14 after transfer were measured for anti-dsDNA IgG antibodies. Red, Cre− recipients; blue, Cre+ recipients; gray, sham recipients. (B) TFH cell frequency as a percentage of total CD4 T cells in peripheral blood and GC B cell frequency as a percentage of CD19+ B cells in peripheral blood. (C) Spleen weights measured on day 14 study end point. (D) Day 14 splenocytes were analyzed for GC B cell frequency and plasma cell frequency as a percentage of CD19+ B cells. (E) Mean fluorescence intensity (MFI) of CD71 on CD4 T cells in the spleen. (F) Frequency of TFH cells in the spleen and ICOS expression on all CD4 T cells in the spleen. (G) CD44 expression MFI on CD4 T cells in the spleen and MitoTracker Green staining. (H) CD71 MFI on CD4 T cells from the LNs. (I) TFH frequency and ICOS expression within CD4 T cells from the LN. (J) BioTracker (2+) labile iron dye staining in CD4 T cells. (K) Lymphocytes were isolated from the kidneys on day 14. Percentage of lymphocyte layer that were CD4 T cells (left) and CD71 expression on CD4 T cells (right). (A) Two-tailed Student’s t test. (B to K) One-way ANOVA with Sidak’s multiple comparisons test.
Spleens and LNs were removed from all recipient mice on day 14. Splenomegaly was significantly affected by CD71 status because the mass of Cre− recipient spleens was doubled compared with Cre+ recipients or sham controls (Fig. 6C). Both GC B cells and plasma cells were expanded in the spleens of Cre− recipients compared with Cre+ (Fig. 6D). Examination of CD4 T cells in the spleen confirmed a significant loss of CD71 expression on T cells in Cre+ recipients, although some CD71 expression was present because of their original T cell compartment (Fig. 6E). Cre− recipients demonstrated a significant expansion of TFH cells in the spleen and increased induced T cell costimulator (ICOS) expression on bulk CD4 T cells (Fig. 6F). These T cells also had higher expression of the activation marker CD44 compared with Cre+ or sham recipients (Fig. 6G). T cell phenotypes in the LNs were consistent with those demonstrated by splenocytes. Cre− recipients had significantly higher CD71 expression (Fig. 6H) and an expanded TFH population (Fig. 6I). CD71 deletion lessened iron accumulation in T cells in vivo (Fig. 6J). Although kidney damage does not occur by day 14 in this model, kidneys were removed to examine early detection of T cell autoreactivity. Lymphocytes purified from kidneys of Cre− recipients tended to have a higher frequency of CD4 T cells (Fig. 6K). Within the CD4 T cells in the kidney, Cre− recipients had significantly higher CD71 expression compared with Cre+ recipients. Together, the bm12 inducible model of SLE supported the hypothesis that CD71 expression on T cells is required for SLE disease.
CD71 expression on T cells corresponds to disease activity and increased TH17 cells in patients with SLE
To test the regulation and role of CD71 and iron metabolism in human T cells, we activated naïve T cells from three healthy donors under either undifferentiated TH0 conditions or TH17 conditions. TH17-skewed T cells from each donor contained significantly higher intracellular iron concentrations than TH0 cells (Fig. 7A), consistent with the role for iron in TH17 differentiation in human T cells. Therefore, T cells from patients with SLE and healthy donors with no history of autoimmune conditions were collected to characterize the expression and role of CD71 (table S6 and fig. S6A). In both control and SLE patient samples, there was a notable correlation between the percentage of TH17 cells and the level of CD71 expression on all CD4 T cells (Fig. 7B), consistent with the relationship between CD71 expression and TH17 cell differentiation in humans. On average, CD71 expression was increased on CD4 T cells from patients with SLE compared with those of controls (Fig. 7C). Patients with SLE also had higher percentages of TH17 cells in their CD4 T cell compartment, and CD71 expression on these cells was elevated in many patients (Fig. 7, D and E).
Fig. 7. CD71 expression correlates with cells in patients with SLE.

TH17 (A) Naïve human T cells were activated for 5 days under nondifferentiating conditions (TH0) or TH17 conditions. Fe measured by ICP-MS and normalized to sulfur (S) for protein content. Paired Student’s t test. (B) PBMCs were isolated from healthy donors (Control) and patients with SLE (SLE). Percentage of TH17 cells in CD4 T cell compartment compared with CD71 expression on bulk CD4 T cells. Controls, black; SLE, red. Pearson correlation was used to determine r value and statistical significance. (C) CD71 expression on bulk CD4T cells. (D) Percentage of CD4T cells defined as TH17 cells. (E) CD71 expression on TH17 cells. (F to H) Flow cytometry data from patients with SLEDAI scores of 3 or less compared with those with scores of 4 or higher. (I) Maximal respiration was determined from Mito Stress Test assay on days 4 to 5 after activation. (J) IL-10 concentrations in day 3 supernatants measured by ELISA. (C to FI) Student’s two-tailed t test. (I and J) Paired Student’s t test.
Despite increased CD71 and CD44 expression, CD69 did not significantly differ in patients with SLE compared with controls, suggesting that high CD71 was not a nonspecific effect of elevated T cell activation (fig. S6B). Furthermore, although patients with SLE often develop anemia, CD71 expression on T cells correlated with hemoglobin levels (fig. S6C), suggesting that anemia itself does not dictate CD4 T cell expression of CD71. Patients with high CD71 expression may represent a subset of SLE with more active disease and TH17 cell involvement. Although all patients were being treated with at least hydroxychloroquine and some with additional therapies (table S6), SLE disease activity assessed by Systemic Lupus Erythematosus Disease Activity Index (SLEDAI) scores showed a trend toward patients with worse disease to have higher CD71 expression on CD4 T cells (Fig. 7F), although there were no apparent differences in the frequency of TH17 cells (Fig. 7G). CD71 expression on TH17 cells, however, did significantly correlate with disease severity despite a limited sample size (Fig. 7H).
Targeting CD71 in T cells from patients with SLE increases IL-10 secretion
To test the effects of CD71 targeting in lupus patient T cell samples, we used a human-specific CD71-blocking antibody, mirroring our previous tests with a murine-specific antibody in SLE1.2.3 mice. The antibody reduced iron uptake in activated T cells (fig. S6D). In agreement with CD71 blockade in murine T cells, anti-CD71 did not interfere with activation of human T cell samples as measured by activation markers CD25 and CD44 (fig. S6E). Extracellular flux analyses of mitochondrial respiration demonstrated a consistent drop in maximal respiration in control T cell samples (Fig. 7I), whereas T cells from patients with SLE had heterogeneous responses, and many showed increased maximal respiration. Despite heterogeneity, CD71 blockade led to a significant increase in IL-10 secretion from T cells from patients with SLE (Fig. 7J). Together, CD71 targeting in SLE patient T cell cultures appeared to regulate mitochondrial function and boost IL-10 production in a subset of samples.
DISCUSSION
Iron metabolism has recently been recognized as a potential driver of disease in patients with SLE. Dietary iron can aggravate lupus symptoms (58), although it is unclear how iron influences immune cell function in the setting of lupus (16). Lowering serum iron in mouse models of lupus has shown promising reductions in autoimmune pathology, but these efforts have focused mainly on innate cells such as macrophages (18, 59). Although iron has been implicated in T cell differentiation of some subsets (TH1, TH2, and TH17), the mechanisms by which iron regulates T cell function have been limited despite a clear role for iron in anabolic and mitochondrial metabolism. Here, we show that targeting iron metabolism via CD71 can reduce disease manifestations of SLE through multiple mechanisms of T cell regulation. First, blocking CD71 lowered intracellular iron and modulated T cell activation in SLE T cells such that activation markers and IL-2 secretion were restored to normal. In SLE T cells, CD71 induction was heightened and remained elevated long after initial stimulus compared with controls. This elevated CD71 is likely driven by increased endosomal recycling to the plasma membrane that could increase accumulation of iron in SLE T cells despite the predisposition for patients with SLE to develop low serum iron. High levels of intracellular iron, in turn, altered mitochondrial respiration and quality control to reduce ATP production efficiency. The effects of CD71 blockade on mitochondrial health and ATP production were apparent only in SLE T cells, suggesting that mitochondria in SLE T cells may be sensitized to changes in iron levels caused by anti-CD71. Second, mTORC1 was also regulated in a CD71-dependent manner. Elevated mTORC1 activity can promote effector T cells, including TH17, suppress Treg function and stability, and may contribute to the finding of increased TH17 and decreased Tregs in patients with SLE (60).
Our study sheds light on iron biology in different T cell subsets and differentiation. iTregs thrived under CD71-targeting conditions, whereas TH1 cultures were depleted because of increased levels of cell death. CD71 targeting was particularly beneficial to iTregs by increasing Foxp3 expression and lowering mTORC1, suggesting that they could have enhanced suppressive capacity or stability. Experiments treating cells with differential cytokine combinations highlight a potential role for TGF-β to suppress CD71 expression during T cell activation, which could feed back on Tregs or suppress CD71 on nearby activated effector T cells. We also show that CD71 expression is associated with TH17 cell development in humans and that TH17 cells from patients with SLE express high levels of CD71. Because many patients with lupus exhibit pathogenic interferon-γ (IFN-γ), IL-17 double producing TH1* cells, one strategy for treating TH17-driven inflammation is to target metabolic regulators of the conversion of nonpathogenic TH17 cells to proinflammatory pathogenic TH17 cells (61, 62). In support of this, iron-deficient mice failed to develop experimental autoimmune encephalomyelitis (EAE) (63), and a CD4 T cell–specific deletion of Tfrc also failed to drive TH17 neuroinflammation via decreased granulocyte-macrophage colony-stimulating factor mRNA stability (64). CD71 blockade was previously shown to inhibit TH17 differentiation partly by increasing IL-2 secretion (29), but our TH17 cell cultures did not produce significantly more IL-2 upon anti-CD71 treatment. TH17 cultures from SLE-prone mice demonstrated a higher propensity for TH17 cell differentiation, which was associated with altered expression of key iron metabolism genes. Regulators of iron metabolism may therefore reveal previously unknown regulators of TH17 cell pathogenicity, and together, these data demonstrate a strong association between sustained CD71 expression, iron accumulation, and development of a pathogenic TH17 program.
In vivo, CD71 blockade was well tolerated, significantly reduced autoantibodies, and prevented disease-specific pathology in the kidneys and liver. A notable finding was that blocking CD71 increased systemic IL-10 levels in the serum and IL-10–producing T cells. Although the physiologic significance of small changes in IL-10 is uncertain, an increased percentage of T cells producing IL-10 could have an enduring impact on inflammation in the T cell compartment. In addition, IL-10 is generally thought to have an anti-inflammatory role; its role in SLE is controversial and has been associated with more active disease (65). This may reflect a compensation mechanism for increased systemic inflammation, although B cells in SLE mice treated with IL-10–blocking antibodies produced fewer autoantibodies (66). IL-10 was also linked to increased apoptosis of CD4 T cells from patients with SLE by inducing Fas cell surface receptor and Fas ligand (FasL) expression (67). However, recent work investigating the dual role of IL-10 in murine lupus showed that blocking the IL-10 receptor in vivo accelerated disease and immune dysregulation (68). Here, we found that SLE1.2.3 mice had a significant reduction in splenomegaly and autoantibody titers that correlated with increased systemic IL-10 upon anti-CD71 treatment. Anti-CD71 appeared to act directly on T cells in vivo because frequencies of CD4 T cell secretion of IL-10 ex vivo were enhanced and Treg frequency was boosted.
Limitations of our study include a limited sample size of samples of patients with SLE further complicated by clinical treatment. Despite this, there appeared to be a subset of patients with SLE with high CD71 expression on TH17 cells, which correlated with a worse SLEDAI score. It is likely that anti-CD71–induced changes in this population maybe concealed in the bulk cultures analyzed here. The antibody blockade treatment used in SLE1.2.3 mice to induce CD71 internalization was well tolerated here and in previous studies (69), and no unintended anemia was observed. However, concentrations of iron in other tissues were not evaluated after treatment, and CD71 expression on other cell types must carefully be considered before targeting CD71 in humans. On the basis of these preliminary results, strategies such as bispecific antibodies that can target CD71 specifically on CD4 T cells could be a safer option for patients with SLE. In addition, given the benefits to Treg populations, CD71 targeting could also benefit patients who have a low TH17/Treg ratio by boosting Treg function and simultaneously depleting TH1* cells. Furthermore, other autoinflammatory TH17-driven diseases display iron deposits in affected tissues such as the central nervous system of patients with multiple sclerosis (MS) (70) and the synovial fluid of patients with rheumatoid arthritis (71), suggesting that these findings may be relevant to inflammatory diseases beyond lupus.
MATERIALS AND METHODS
Study design
For in vitro experiments, primary murine naïve CD4 T cells were isolated from the spleens and LNs of female control C57BL/6 (JAX, #000664) or age-matched lupus-prone SLE1.2.3 mice (JAX, #007228) using the CD4+CD62L+ T cell isolation kit according to the manufacturer’s instructions (Miltenyi Biotec). CD62L-positive selection was routinely ~98% in purity, as determined by flow cytometry. Cell cultures were activated in the presence of either anti-CD71 (BioLegend, 113821) or isotype control (IgG2a; BioLegend, 400543) at 2 μg/ml, and downstream experiments were performed between days 3 and 6 after activation. For in vivo anti-CD71 experiments, female control or age-matched SLE1.2.3 mice were treated with 200 μg of CD71-blocking antibody (clone R17 217.1.3/TIB-219) or an isotype control antibody starting at 4 to 5 months of age (Bio X Cell). Treatment was administered twice a week via intraperitoneal injection for 4 weeks.
Mice
All experiments were performed at Vanderbilt University with Institutional Animal Care and Utilization Committee–approved protocols. Cages were maintained in a pathogen-free facility with ventilated cages and ad libitum food and water. At the time of euthanasia, a terminal blood draw was performed, and complete blood count analysis was obtained using the Forcyte (Oxford Science) hematology analyzer. Full gross examination and tissue collection were performed by a board-certified veterinary pathologist, and tissues were immersion-fixed in 10% neutral buffered formalin for about 3 days before routine processing and embedding in paraffin. Sections were cut at 5 μm and stained with hematoxylin and eosin (H&E) for analysis.
Tfrcfl/fl mice were purchased from the Jackson Laboratory (JAX, #028363) and bred with CD4cre mice (JAX, #022071). For bm12 transfer experiments, splenocytes and LNs were isolated from Tfrcfl/fl homozygous mice that were either CD4cre positive or negative. Flow cytometry confirmed that the percentage of CD4 T cells in the single-cell suspension was similar between Cre-negative and Cre-positive mice. About 30 × 106 splenocytes were intraperitoneally injected into 11-week-old bm12 recipients (JAX, #001162), adjusting for CD4 T cell frequencies so that each mouse received the same number of T cells. Experiments were sex-matched such that male cells were transferred to male recipients and female donors were transferred into females. Serum samples were collected on days 3, 8, and 14 after transfer. Fourteen days after transfer was the end point of the study, at which time spleens, LNs, and kidneys were collected for flow cytometric analyses. Kidneys were placed in collagenase II (Sigma-Aldrich) in Hank’s balanced salt solution (HBSS) for 30 min at 37°C for digestion, processed through a 70-μm filter, and then subjected to a Percoll gradient to isolate the lymphocyte layer before flow cytometry.
Patient samples
Blood samples were obtained from patients with SLE, and control subjects were enrolled in the Inflammation, Cardiovascular Disease, and Autoimmunity in Rheumatic Diseases Study at the Vanderbilt University Medical Center. For inclusion in the study, all individuals were required to be 18 years of age or older. Patients required a rheumatologist diagnosis of SLE for inclusion, and all patients with SLE met the 1997 American College of Rheumatology revised classification criteria for SLE (72). Control subjects were excluded if they had an inflammatory autoimmune disease. The Vanderbilt University Medical Center Institutional Review Board approved the study (IRB no. 150544), and all individuals provided written informed consent. Clinical information was gathered via chart review by a rheumatologist. Peripheral blood was collected in heparin-coated tubes. PBMCs were then isolated by Ficoll gradient separation, subjected to flow cytometry, and stored in liquid nitrogen.
Two panels of antibodies were run on patient PBMC samples. Flow cytometry was performed on freshly isolated PBMCs before long-term storage. All antibodies were purchased from BioLegend. The first panel was used to quantify CD71 and activation markers on bulk CD4 T cells [CD3-APC/Cy7 (clone HIT3a), CD4-PE/Cy7 (clone a161A1), CD25-BV605 (clone BC96), CD44–eFluor 450 (clone IM7), CD69–FITC (fluorescein isothiocyanate) (clone FN50), and CD71-APC (clone CY1G4)]. The second panel was used to quantify TH17 cells and CD71 expression [CD3-APC/Cy7 (clone HIT3a), CD4-PE/Cy7 (clone a161A1), CXCR3–Paciflc Blue (clone G025H7), CCR4-BV605 (clone L291H4), CCR6-FITC (clone G034E3), and CD71-APC (clone CY1G4)]. Compensation was conducted using single-stain PBMC controls. A third panel was used to measure activation and memory status after activation: CD62L–Alexa Fluor 488 (clone DREG-56) and CD45RA-PECy5 (clone HI100) were used with the previous CD3, CD4, CD44, and CD71 antibodies.
For activation and culture of patient T cells, CD4 T cells were purified by negative selection using the human CD4 T Cell Isolation Kit (Miltenyi Biotec). Some samples were stored in liquid nitrogen before T cell isolations and functional assays were performed. T cells were activated with T cell activation/expansion CD2/3/28 beads at a ratio of 1:2 bead to cells (Miltenyi Biotec). Cultures were maintained in HPLM + 5% dialyzed fetal bovine serum (FBS; Sigma-Aldrich) and supplemented with recombinant human IL-2 (rhIL-2; 100 U/ml) from day 3 after activation. For CD71 blockade experiments, cells were activated in the presence of either anti-human CD71 (clone OKT9, Bio X Cell) or mouse IgG1 isotype control (clone MOPC-21) at 2 μg/ml.
Cell cultures
Naïve T cells were activated with irradiated splenocytes (irradiated at 30 gray) in the presence of anti-CD3 (1 μg/ml). Unstimulated controls were incubated with murine IL-27 (mIL-7) at 0.1 μg/ml. T cells were cultured at 37°C with 5% CO2 in RPMI 1640 supplemented with 10 mM Hepes, 25 μM 2-mercaptoethanol, penicillin-streptomycin (100 U/ml), and 10% heat-inactivated FBS (Sigma-Aldrich). Cultures were supplemented with rhIL-2 (100 U/ml) from day 3 after activation. For differentiation of murine naïve CD4 T cells, medium was supplemented with IL-12p70 (10 ng/ml), IL-2 (100 U/ml), anti–IL-4 (10 μg/ml), and anti–IFN-γ (1 μg/ml) for TH1 cells or TGF-β1 (1.5 ng/ml), IL-2 (100 U/ml), anti–IL-4 (10 μg/ml), and anti–IFN-γ (10 μg/ml) for iTregs. For TH17 cells, anti–IL-4 (10 μg/ml), anti–IFN-γ (10 μg/ml), TGF-β1 (1 ng/ml), IL-23 (10 ng/ml), IL-6 (50 ng/ml), and IL-1β (10 ng/ml) were used. For human T cell differentiation, naïve CD4 T cells were isolated using the Naïve CD4 T Cell Isolation Kit II (Miltenyi Biotec). Human T cell TH17 cultures were activated with non–tissue culture–treated plates with plate-bound anti-CD3 (3 μg/ml), anti-CD28 (1 μg/ml), and anti-ICOS (1 μg/ml) antibodies. HPLM was supplemented with anti–IL-4 (2 μg/ml), anti–IFN-γ (2 μg/ml), IL-23 (50 ng/ml), IL-1β (50 ng/ml), TGF-β1 (5 ng/ml), IL-21 (25 ng/ml), and IL-6 (40 ng/ml). All cytokines were purchased from PeproTech except for IL-1β (R&D Systems).
The Plat-E Retroviral Packaging Cell Line (American Type Culture Collection) was maintained at 37°C with 5% CO2 in Dulbecco’s modified Eagle’s medium supplemented with 10% FBS, penicillin-streptomycin (100 U/ml), puromycin (1 μg/ml), and blasticidin (10 μg/ml). Cell lines were tested for mycoplasma using the MycoProbe Mycoplasma Detection Kit (R&D Systems).
Flow cytometry
For intracellular and transcription factor stains, cells were first stained with viability dye ± cell surface antibodies, fixed and permeabilized, and then stained for intracellular proteins with the appropriate kits. Transcription factor staining consisted of the eBioscience Foxp3/Transcription Factor Staining Buffer Set. For cytokine stains, cells were restimulated with 12-myristate 13-acetate (PMA; 1 μg/ml) and ionomycin (750 ng/ml) in the presence of GolgiPlug and GolgiStop for 4 hours and then processed as other intracellular stains. Unstimulated cells served as a negative control. Antibodies for IL-10–producing T cells were as follows: CD4-e450 (clone GK1.5) and IL-10–PE (clone JES5-16E3). For immunophenotyping panels, cells were pretreated with TruStain FcX PLUS before surface staining (BioLegend). B cells were quantified with B220-e450 (clone RA3-6B2) and CD19-APC (clone 6D5). Tregs and Tfr cells were quantified with CD4-PECy7, CD25-APC (clone PC61.5), Foxp3-e450 (clone FJK-16s), and Bcl-6-FITC (clone 7D1). Activation markers used were as follows: CD25-PE, CD44-PECy5 (clone IM7), CD69-FITC (clone H1.2F3), CD62L-APC (clone MEL-14), p-S6 (Ser235,236)–APC (clone cupk43k), and c-MAF–PE (BD, clone T54-853). For bm12 cytometry panels, gating strategies of plasma cells, GC B cells, and TFH cells followed previous methods (57). For TFH cells, CD4-SuperBright600 (Thermo Fisher Scientific, clone GK1.5), CXCR5-APC (clone L138D7), PD-1-PE (clone 29F.1A12), and ICOS-PECy5 (clone 15F9) were used. For B cells, CD19-APC (clone 6D5), CD138-BV605 (clone 281-2), GL-7-PE (clone GL7), and Fas-PerCPCy5.5 (clone SA367H8) were used.
For mitochondrial dyes, MitoTracker Green and MitoSOX Red (Thermo Fisher Scientific) were combined with cell surface CD4-e450 and CD71-APC antibody in complete medium at 37°C with 5% CO2 for 25 min. Labile iron staining was conducted with BioTracker Far Red Labile 2+ Live Cell Dye (Millipore). Cells were first washed with HBSS and then stained for 30 min at 37°C with 5% CO2 in a 5 μM solution of dye in HBSS. Unstimulated T cells and T cells with no dye were used as negative controls. All cells were coincubated with GhostRedDye 780 (Cell Signaling Technology) along with mitochondrial dyes and gated on viable cells during analysis.
CRISPR-Cas9 screens
Details for library design and preparation were previously described (73). Briefly, gRNA sequences were chosen from the Brie library. Four gRNA sequences for each gene and five nontargeting controls, flanked by adapter sequences, were purchased as an oligo pool from Twist Bioscience. The iron metabolism library contained 55 total gene targets and 225 total gRNAs. The pMx-U6-gRNA-GFP vector was previously modified to express blue fluorescent protein in place of green fluorescent protein (GFP), and oligos were cloned into this vector using Gibson Assembly Master Mix. DNA was packaged into retrovirus after transfection of the Plat-E Retroviral Packaging Cell Line. Retroviral transduction of primary T cells was performed with RetroNectin-coated plates (Takara Bioscience). Naïve T cells had been activated as described in the “Cell cultures” section for 2 days before transduction. CRISPR-Cas9 screens were conducted in HPLM (74) and supplemented with rhIL-2 (100 U/ml) after transduction.
Collection and analysis of the gRNA frequencies over time followed the same methodology as previously described by Sugiura et al. (73). At least 1000-fold representation of the library was maintained throughout the process of cell harvesting, amplification, and sequencing. FASTQ files were analyzed using the Model-based Analysis of Genome-wide CRISPR/Cas9 Knockout (MAGeCK v0.5.0.3) method to determine statistically significant gRNA enrichments or depletions.
Enzyme-linked immunosorbent assays
Autoantibodies were measured with enzyme-linked immunosorbent assay (ELISA) kits purchased from Alpha Diagnostics: anti-histone total Ig, ANA total Ig, and anti-dsDNA total Ig. Serum was diluted 1:500, and samples were run in technical duplicates. Optical density at 450 nm was measured on the Cytation5 Imager. For cytokine measurements, serum was subjected to the LEGENDplex Mouse Inflammation Panel assay (BioLegend). Technical duplicates were averaged and compared with a standard curve according to the manufacturer’s protocol. IL-10 in human cell culture supernatants were measured using the LEGEND MAX Human IL-10 ELISA Kit (BioLegend). Technical duplicates were averaged and then normalized to the total number of live cells in each sample at the time of collection. Murine IL-2 concentrations were measured using the LEGEND MAX Mouse IL-2 ELISA Kit (BioLegend). Supernatants were diluted 1:100, and absorbance values were normalized to the standard curve. HFE concentrations in patient sera were measured using the Human Hemochromatosis Protein (HFE) ELISA Kit (Abbexa, #abx387783).
Extracellular flux analyses
Extracellular flux analysis was performed with the Seahorse XFe96 Analyzer (Agilent). Plates were coated with Cell-Tak solution (Corning) for 30 min at room temperature before seeding the cells. A total of 150,000 viable cells were seeded per well, and a minimum of five technical replicates were seeded for each sample. Final cell counts of each well were acquired by bright-field imaging using a Cytation5 imager for normalization. The glycolysis stress test was performed according to the Agilent protocol recommendations. The Mito Stress Test was performed with oligomycin A at 1.5 μM, carbonyl cyanide p-trifluoromethoxyphenylhydrazone (FCCP) at 1.5 μM, and rotenone/antimycin A at 0.5 μM final concentrations.
Confocal microscopy
Measurement of transferrin/CD71 internalization was adapted from the work of Lesteberg et al. (42). CD4 T cells were activated for 3 days under TH0 conditions and then transferred into a 96-well U-bottom plate (150,000 cells per well). Cells were starved in phenol-red free RPMI 1640 with no serum for 45 min and then treated with mouse transferrin–horseradish peroxidase protein (0.01 mg/ml; Thermo Fisher Scientific, #31453) for the indicated time points. Cells were washed twice in phenol-red free RPMI 1640 and then transferred to poly-l-lysine–coated slides (Electron Microscopy Sciences) and rested for 15 min at 37°C with 5% CO2 for attachment. Samples were then immediately fixed with formalin (Sigma-Aldrich, HT501128) for 20 min at room temperature and permeabilized with 0.5% Triton X-100 for 10 min at room temperature. Samples were blocked for 1.5 hours with blocking solution [0.2% cold water fish gelatin + 0.5% bovine serum albumin in phosphate-buffered saline (PBS)] and stained with primary antibody in blocking solution overnight (anti-CD71, 2 μg/ml), washed three times for 10 min at room temperature, and then stained with secondary antibodies for 1 hour at room temperature. Secondary antibodies were as follows: goat anti-rat IgG2a-FITC (Invitrogen) 1:1000 + Rab8–Alexa Fluor 594 (4 μg/ml; BioLegend). Images were taken at the Vanderbilt Cell Imaging Shared Resource Core using the Zeiss LSM 880 microscope at ×20 magnification. At least three fields of view were captured for each biological sample for quantification of colocalization by the image calculator function on Fiji software.
RNA sequencing and quantitative reverse transcription polymerase chain reaction
Naïve CD4 T cells were isolated from female healthy control or SLE1.2.3 mice and activated in TH17 conditions for 5 days. IL-17a production was confirmed on day 5 by flow cytometry and was ~35 to 40% of cells in both the control or SLE1.2.3 cultures. Cells were washed with cold PBS, and RNA extraction was conducted with deoxyribonuclease treatment according to the RNeasy Plus Mini Kit (QIAGEN). mRNA enrichment and cDNA library preparation were performed using the stranded mRNA (polyadenylate-selected) library preparation kit. Sequencing was performed with pairedend 150 base pairs on the Illumina NovaSeq6000 targeting 50 million reads per sample (rps) at Vanderbilt University Medical Center’s Vanderbilt Technologies for Advanced Genomics core. Alignment percentages for all samples were above 99%. FASTQ analysis was conducted by Vanderbilt Technologies for Advanced Genomics Analysis and Research Design. Differential expression analysis criteria were as follows: fold change ≥ 2 and false discovery rate ≤ 0.05. Software versions were as follows: Cutadapt v2.10, DESeq2 v1.24.0, WebGestaltR v0.4.4, FastQC v0.11.9, STAR v2.7.3a, and featureCounts v2.0.0.
For quantitative reverse transcription polymerase chain reaction (qRT-PCR), RNA extraction was performed as described for RNA sequencing, and then, equal amounts of RNA for each sample were subjected to cDNA synthesis using the iScript cDNA Synthesis Kit (Bio-Rad). Tfrc transcripts were measured by forward 5’-GTGACGTAGATCCAGAGGGC-3’ and reverse 5’-CGCCTCTACAGTCCGCAAT-3’ primers with the same cycling conditions and instrumentation as previously described (73).
Inductively coupled plasma mass spectrometry
To measure intracellular iron concentrations, equal cell numbers were determined and placed into metal-free 15-ml conicals (VWR). Cell pellets were washed twice with 10 ml of PBS and then stored at –80°C until downstream processing. Pellets were digested in 200 μl of Optima-grade nitric acid (Fisher) and 50 μl of Ultratrace-grade hydrogen peroxide (Sigma-Aldrich) and incubated overnight at 65°C. The next day, 2 ml of ultrapure-grade water (Invitrogen) were added before analysis.
Elemental quantification on acid-digested samples was performed using an Agilent 7700 inductively coupled plasma mass spectrometer (ICP-MS; Agilent, Santa Clara, CA) attached to a Teledyne CETAC Technologies ASX-560 autosampler (Teledyne CETAC Technologies, Omaha, NE). The following settings were fixed for the analysis: Cell Entrance = −40 V, Cell Exit = −60 V, Plate Bias = −60 V, OctP Bias = −18 V, and collision cell Helium Flow = 4.5 ml/min. Optimal voltages for Extract 2, Omega Bias, Omega Lens, OctP RF, and Deflect were determined empirically before each sample set was analyzed. Element calibration curves were generated using ARISTAR ICP Standard Mix (VWR, Radnor, PA). Samples were introduced by peristaltic pump with 0.5–mm–internal diameter tubing through a Micro Mist borosilicate glass nebulizer (Agilent). Samples were initially up taken at 0.5 rps for 30 s, followed by 30 s at 0.1 rps to stabilize the signal. Samples were analyzed in Spectrum mode at 0.1 rps, collecting three points across each peak and performing three replicates of 100 sweeps for each element analyzed. Sampling probe and tubing were rinsed for 20 s at 0.5 rps with 2% nitric acid between every sample. Data were acquired and analyzed using the Agilent Mass Hunter Workstation Software version A.01.02.
Histology and immunohistochemistry
H&E sections were scored in a semiquantitative fashion by a pathologist (56). For liver sections, perivascular inflammatory cell infiltrates were scored on a scale from 0 to 3, where 0 represents no pathology; 1 represents mild, rare, few inflammatory cells; 2 represents multifocal to coalescing zones of inflammatory cells; and 3 represents severe, coalescing to diffuse inflammatory infiltrate. In the kidney sections, interstitial inflammation was scored using the same scoring system as described for the liver.
Immunoblot
Whole cell lysates were collected from T cell samples as described previously (75). Antibodies for immunoblot analysis were Irp2 (IREB2; Thermo Fisher Scientific, PA5-19158), HFE (Invitrogen, PA5-37364), and β-actin (Cell Signaling Technology, 3700S). Blots were incubated with IRDye anti-rabbit or anti-mouse secondary antibodies (LI-COR) and imaged using the Odyssey CLx instrument. Band intensity quantification was conducted with Studio Lite software (LI-COR), and total protein signals were normalized to the β-actin signal for each sample.
Transmission EM
T cells were activated as described previously and supplemented with IL-2 on day 3. On day 5, cells were washed with warm PBS and then fixed in 2.5% glutaraldehyde in 0.1 M cacodylate for 1 hour at room temperature, followed by 24 hours at 4°C. After fixation, the cells were postfixed in 1% OsO4 and en bloc stained with 1% uranyl acetate dehydrated in a graded ethanol series. Samples were gradually infiltrated with Quetol 651–based Spurr’s resin with propylene oxide as the transition solvent. The Spurr’s resin was polymerized at 60°C for 48 hours. Blocks were sectioned on a Leica UC7 ultramicrotome at 70-nm nominal thickness, and the samples were stained with 2% uranyl acetate and lead citrate. Transmission EM was performed using a Tecnai T12 operating at 100 kV with an AMT NanoSprint complementary metal-oxide semiconductor camera using AMT imaging software for single images and SerialEM for tiled datasets. Tiled datasets were reconstructed using the IMOD/ETomo software suite. Mitochondria quantification was done in Fiji by manually segmenting all mitochondria within cell cross sections from the tiled transmission EM datasets until at least 100 mitochondria were measured. Mitochondria area fraction was determined by summing the cross-sectional area of all mitochondria within a cell divided by the area of the entire cell.
Statistics
Statistical analyses were performed with GraphPad Prism software (v9). For all figures, statistically significant results are labeled as follows: *P < 0.05, **P < 0.01, ***P < 0.001, and ****P ≤ 0.001. For a comparison of two groups, Student’s t test was performed. For more than two groups, one-way analysis of variance (ANOVA) was performed. Figures with data points connected by lines are indicative of paired analyses, whereas all other statistical tests were unpaired. In all figures, error bars represent means ± SD.
Supplementary Material
Acknowledgments:
We thank A. Oeser for collecting patient samples and K. L. Beier and M. Z. Madden for technical assistance on certain experiments and helpful discussions. K.V. would like to thank J. E. Bader for helping with in vivo CD71 experiments as needed.
Funding:
J.C.R. is supported by NIH grants R01DK105550 and R01AI153167 and the Lupus Research Alliance William Paul Distinguished Innovator award. K.V. is supported by NIH grant T32 DK101003. E.P.S. is supported by NIH grant R01AI150701. E.N.A. is supported by NIH grant K00CA253718. The Translational Pathology Shared Resource Core of VUMC is supported by NCI/NIH Cancer Center Support Grant 5P30 CA68485-19 and Shared Instrumentation Grant S10 OD023475-01A1. The Vanderbilt Cell Imaging Shared Resource Core is supported by NIH grants CA68485, DK20593, DK58404, DK59637, and EY08126.
Competing interests:
J.C.R. is a founder, scientific advisory board member, and stockholder of Sitryx Therapeutics; a scientific advisory board member and stockholder of Caribou Biosciences; a member of the scientific advisory board of Nirogy Therapeutics; has consulted for Merck, Pfizer, and Mitobridge within the past 3 years; and has received research support from Incyte Corp., Calithera Biosciences, and Tempest Therapeutics. K.V. and J.C.R. have filed a provisional patent application entitled “CD71-blocking antibodies for treating autoimmune and inflammatory diseases” (U.S. Provisional Patent Application No: 63/274,297).
Data and materials availability:
The deposited data for RNA sequencing experiments are available under the NCBI GEO accession number GSE212663. All materials using or generated in this study are available to researchers following appropriate standard material transfer agreement.
REFERENCES AND NOTES
- 1.Yang S-K, Zhang H-R, Shi S-P, Zhu Y-Q, Song N, Dai Q, Zhang W, Gui M, Zhang H, The role of mitochondria in systemic lupus erythematosus: A glimpse of various pathogenetic mechanisms. Curr. Med. Chem 27, 3346–3361 (2020). [DOI] [PubMed] [Google Scholar]
- 2.Gergely P, Grossman C, Niland B, Puskas F, Neupane H, Allam F, Banki K, Phillips PE, Perl A, Mitochondrial hyperpolarization and ATP depletion in patients with systemic lupus erythematosus. Arthritis Rheum. 46, 175–190(2002). [DOI] [PMC free article] [PubMed] [Google Scholar]
- 3.Sharabi A, Tsokos G, T cell metabolism: New insights in systemic lupus erythematosus pathogenesis and therapy. Nat. Rev. Rheumatol 16, 100–112 (2020). [DOI] [PubMed] [Google Scholar]
- 4.Zhang C-X, Wang H-Y, Yin L, Mao Y-Y, Zhou W, Immunometabolism in the pathogenesis of systemic lupus erythematosus. J Transl Autoimmun 3, 100046 (2020). [DOI] [PMC free article] [PubMed] [Google Scholar]
- 5.Jakiela B, Kosałka J, Plutecka H, Bazan-Socha S, Sanak M, Musiał J, Facilitated expansion of Th17 cells in lupus nephritis patients. Clin. Exp. Immunol 194, 283–294 (2018). [DOI] [PMC free article] [PubMed] [Google Scholar]
- 6.Tsanaktsi A, Solomou EE, Liossis SNC, Th1/17 cells, a subset of Th17 cells, are expanded in patients with active systemic lupus erythematosus. Clin. Immunol 195, 101–106 (2018). [DOI] [PubMed] [Google Scholar]
- 7.Cluxton D, Petrasca A, Moran B, Fletcher JM, Differential regulation of human Treg and Th17 cells by fatty acid synthesis and glycolysis. Front. Immunol 10, 115 (2019). [DOI] [PMC free article] [PubMed] [Google Scholar]
- 8.Johnson MO, Wolf MM, Madden MZ, Andrejeva G, Sugiura A, Contreras DC, Maseda D, Liberti MV, Paz K, Kishton RJ, Johnson ME, de Cubas AA, Wu P, Li G, Zhang Y, Newcomb DC, Wells AD, Restifo NP, Rathmell WK, Locasale JW, Davila ML, Blazar BR, Rathmell JC, Distinct regulation of Th17 and Th1 cell differentiation by glutaminase-dependent metabolism. Cell 175, 1780–1795.e19 (2018). [DOI] [PMC free article] [PubMed] [Google Scholar]
- 9.Michalek RD, Gerriets VA, Jacobs SR, Macintyre AN, Maclver NJ, Mason EF, Sullivan SA, Nichols AG, Rathmell JC, Cutting edge: Distinct glycolytic and lipid oxidative metabolic programs are essential for effector and regulatory CD4+ T cell subsets., J. Immunol 186, 3299–3303 (2011). [DOI] [PMC free article] [PubMed] [Google Scholar]
- 10.Li W, Qu G, Choi S-C, Cornaby C, Titov A, Kanda N, Teng X, Wang H, Morel L, Targeting T cell activation and lupus autoimmune phenotypes by inhibiting glucose transporters. Front. Immunol 10, 833(2019). [DOI] [PMC free article] [PubMed] [Google Scholar]
- 11.Mehta MM, Chandel NS, Targeting metabolism for lupus therapy. Sci. Transl. Med 7, 274fs275 (2015). [DOI] [PubMed] [Google Scholar]
- 12.Kidani SBY, Lipids rule: Resetting lipid metabolism restores T cell function in systemic lupus erythematosus. J. Clin. Invest 124, 482–485 (2014). [DOI] [PMC free article] [PubMed] [Google Scholar]
- 13.Yin Y, Choi S-C, Xu Z, Zeumer L, Kanda N, Croker BP, Morel L, Glucose oxidation is critical for CD4+ T cell activation in a mouse model of systemic lupus erythematosus. J. Immunol 196, 80–90 (2016). [DOI] [PMC free article] [PubMed] [Google Scholar]
- 14.Yin Y, Choi SC, Xu Z, Perry DJ, Seay H, Croker BP, Sobel ES, Brusko TM, Morel L, Normalization of CD4+ T cell metabolism reverses lupus. Sci. Transl. Med 7, 1–12 (2015). [DOI] [PMC free article] [PubMed] [Google Scholar]
- 15.Wincup C, Sawford N, Rahman A, Pathological mechanisms of abnormal iron metabolism and mitochondrial dysfunction in systemic lupus erythematosus. Expert Rev. Clin. Immunol 17, 1–11 (2021). [DOI] [PMC free article] [PubMed] [Google Scholar]
- 16.Wlazlo E, Mehrad B, Morel L, Scindia Y, Iron metabolism: An under investigated driver of renal pathology in lupus nephritis. Front. Med. (Lausanne) 8, 643686(2021). [DOI] [PMC free article] [PubMed] [Google Scholar]
- 17.Billesbølle CB, Azumaya CM, Kretsch RC, Powers AS, Gonen S, Schneider S, Arvedson T, Dror RO, Cheng Y, Manglik A, Structure of hepcidin-bound ferroportin reveals iron homeostatic mechanisms. Nature 586, 807–811 (2020). [DOI] [PMC free article] [PubMed] [Google Scholar]
- 18.Scindia Y, Wlazlo E, Ghias E, Cechova S, Loi V, Leeds J, Ledesma J, Helen C, Swaminathan S, Modulation of iron homeostasis with hepcidin ameliorates spontaneous murine lupus nephritis. Kidney Int. 98, 100–115 (2020). [DOI] [PubMed] [Google Scholar]
- 19.Voulgarelis KS, Anaemia in systemic lupus erythematosus: Aetiological profile and the role of erythropoietin. Ann. Rheum. Dis 59, 217–222 (2000). [DOI] [PMC free article] [PubMed] [Google Scholar]
- 20.Giannouli VM, Anaemia in systemic lupus erythematosus: From pathophysiology to clinical assessment. Ann. Rheum. Dis 65, 144–148 (2006). [DOI] [PMC free article] [PubMed] [Google Scholar]
- 21.Zhao M, Li M-Y, Gao X-F, Jia S-J, Gao K-Q, Zhou Y, Zhang H-H, Huang Y, Wang J, Wu H-J, Lu Q-J, Downregulation of BDH2 modulates iron homeostasis and promotes DNA demethylation in CD4+ T cells of systemic lupus erythematosus. Clin. Immunol 187, 113–121 (2018). [DOI] [PubMed] [Google Scholar]
- 22.Gao X, Song Y, Wu J, Lu S, Min X, Liu L, Hu L, Zheng M, Du P, Yu Y, Long H, Wu H, Jia S, Yu D, Lu Q, Zhao M, Iron-dependent epigenetic modulation promotes pathogenic T cell differentiation in lupus. J. Clin. Invest 132, e152345 (2022). [DOI] [PMC free article] [PubMed] [Google Scholar]
- 23.Jabara HH, Boyden SE, Chou J, Ramesh N, Massaad MJ, Benson H, Bainter W, Fraulino D, Rahimov F, Sieff C, Liu Z-J, Alshemmari SH, Al-Ramadi BK, Al-Dhekri H, Arnaout R, Abu-Shukair M, Vatsayan A, Silver E, Ahuja S, Davies EG, Sola-Visner M, Ohsumi TK, Andrews NC, Notarangelo LD, Fleming MD, Al-Herz W, Kunkel LM, Geha RS, A missense mutation in TFRC, encoding transferrin receptor 1, causes combined immunodeficiency. Nat. Genet 48, 74–78 (2016). [DOI] [PMC free article] [PubMed] [Google Scholar]
- 24.Aljohani AH, Al-Mousa H, Arnaout R, Al-Dhekri H, Mohammed R, Alsum Z, Nicolas-Jilwan M, Alrogi F, Al-Muhsen S, Alazami AM, Al-Saud B, Clinical and immunological characterization of combined immunodeficiency due to TFRC mutation in eight patients. J. Clin. Immunol 40, 1103–1110 (2020). [DOI] [PMC free article] [PubMed] [Google Scholar]
- 25.Frost JN, Tan TK, Abbas M, Wideman SK, Bonadonna M, Stoffel NU, Wray K, Kronsteiner B, Smits G, Campagna DR, Duarte TL, Lopes JM, Shah A, Armitage AE, Arezes J, Lim PJ, Preston AE, Ahern D, Teh M, Naylor C, Salio M, Gileadi U, Andrews SC, Dunachie SJ, Zimmermann MB, van der Klis FRM, Cerundolo V, Bannard O, Draper SJ, Townsend ARM, Galy B, Fleming MD, Lewis MC, Drakesmith H, Hepcidin-mediated hypoferremia disrupts immune responses to vaccination and infection. Med (N Y) 2, 164–179.e12 (2021). [DOI] [PMC free article] [PubMed] [Google Scholar]
- 26.Elmadfa I, Meyer AL, The role of the status of selected micronutrients in shaping the immune function. Endocr. Metab. Immune Disord. Drug Targets 19, 1100–1115 (2019). [DOI] [PMC free article] [PubMed] [Google Scholar]
- 27.Pfeifhofer-Obermair C, Tymoszuk P, Nairz M, Schroll A, Klais G, Demetz E, Engl S, Brigo N, Weiss G, Regulation of Th1 T cell differentiation by iron via upregulation of T cell immunoglobulin and mucin containing protein-3 (TIM-3). Front. Immunol 12, 637809 (2021). [DOI] [PMC free article] [PubMed] [Google Scholar]
- 28.Thorson JA, Smith KM, Gomez F, Naumann PW, Kemp JD, Role of iron in T cell activation: TH1 clones differ from TH2 clones in their sensitivity to inhibition of DNA synthesis caused by IgG Mabs against the transferrin receptor and the iron chelator deferoxamine. Cell. Immunol 134, 126–137 (1991). [DOI] [PubMed] [Google Scholar]
- 29.Li L, Xia Y, Yuan S, Li F, Xie X, Luo Y, Yang XP, He R, Iron deprivation restrains the differentiation and pathogenicity of T helper 17 cell. J. Leukoc. Biol 110, 1057–1067 (2021). [DOI] [PubMed] [Google Scholar]
- 30.Talaat RM, Mohamed SF, Bassyouni IH, Raouf AA, Th1/Th2/Th17/Treg cytokine imbalance in systemic lupus erythematosus (SLE) patients: Correlation with disease activity. Cytokine 72, 146–153 (2015). [DOI] [PubMed] [Google Scholar]
- 31.Cronin SJF, Woolf CJ, Weiss G, Penninger JM, The role of iron regulation in immunometabolism and immune-related disease. Front. Mol. Biosci 6, 116 (2019). [DOI] [PMC free article] [PubMed] [Google Scholar]
- 32.Aune TM, Crooke PS III, Patrick AE, Tossberg JT, Olsen NJ, Spurlock CF III, Expression of long non-coding RNAs in autoimmunity and linkage to enhancer function and autoimmune disease risk genetic variants. J. Autoimmun 81, 99–109 (2017). [DOI] [PMC free article] [PubMed] [Google Scholar]
- 33.Hutcheson J, Scatizzi JC, Siddiqui AM, Haines GK III, Wu T, Li QZ, Davis LS, Mohan C, Perlman H, Combined deficiency of proapoptotic regulators Bim and Fas results in the early onset of systemic autoimmunity. Immunity 28, 206–217 (2008). [DOI] [PubMed] [Google Scholar]
- 34.Becker AM, Dao KH, Han BK, Kornu R, Lakhanpal S, Mobley AB, Li QZ, Lian Y, Wu T, Reimold M, Olsen NJ, Karp DR, Chowdhury FZ, Farrar JD, Satterthwaite AB, Mohan C, Lipsky PE, Wakeland EK, Davis LS, SLE peripheral blood B cell, T cell and myeloid cell transcriptomes display unique profiles and each subset contributes to the interferon signature. PLOS ONE 8, e67003 (2013). [DOI] [PMC free article] [PubMed] [Google Scholar]
- 35.Waheed A, Grubb JH, Zhou XY, Tomatsu S, Fleming RE, Costaldi ME, Britton RS, Bacon BR, Sly WS, Regulation of transferrin-mediated iron uptake by HFE, the protein defective in hereditary hemochromatosis. Proc. Natl. Acad. Sci. U.S.A 99, 3117–3122 (2002). [DOI] [PMC free article] [PubMed] [Google Scholar]
- 36.Pang M, Setoyama Y, Tsuzaka K, Yoshimoto K, Amano K, Abe T, Takeuchi T, Defective expression and tyrosine phosphorylation of the T cell receptor zeta chain in peripheral blood T cells from systemic lupus erythematosus patients. Clin. Exp. Immunol 129, 160–168 (2002). [DOI] [PMC free article] [PubMed] [Google Scholar]
- 37.Moulton VR, Tsokos GC, T cell signaling abnormalities contribute to aberrant immune cell function and autoimmunity. J. Clin. Invest 125, 2220–2227 (2015). [DOI] [PMC free article] [PubMed] [Google Scholar]
- 38.Crampton SP, Morawski PA, Bolland S, Linking susceptibility genes and pathogenesis mechanisms using mouse models of systemic lupus erythematosus. Dis. Model. Mech 7, 1033–1046 (2014). [DOI] [PMC free article] [PubMed] [Google Scholar]
- 39.Morel L, Perry D, Sang A, Yin Y, Zheng YY, Murine models of systemic lupus erythematosus. J. Biomed. Biotechnol 2011, 271694 (2011). [DOI] [PMC free article] [PubMed] [Google Scholar]
- 40.Crispin JC, Keenan BT, Finnell MD, Bermas BL, Schur P, Massarotti E, Karlson EW, Fitzgerald LM, Ergin S, Kyttaris VC, Tsokos GC, Costenbader KH, Expression of CD44 variant isoforms CD44v3 and CD44v6 is increased on T cells from patients with systemic lupus erythematosus and is correlated with disease activity. Arthritis Rheum. 62, 1431–1437 (2010). [DOI] [PMC free article] [PubMed] [Google Scholar]
- 41.Anderson CP, Shen M, Eisenstein RS, Leibold EA, Mammalian iron metabolism and its control by iron regulatory proteins. Biochim. Biophys. Acta 1823, 1468–1483 (2012). [DOI] [PMC free article] [PubMed] [Google Scholar]
- 42.Lesteberg K, Orange J, Makedonas G, Recycling endosomes in human cytotoxic T lymphocytes constitute an auxiliary intracellular trafficking pathway for newly synthesized perforin. Immunol. Res 65, 1031–1045 (2017). [DOI] [PMC free article] [PubMed] [Google Scholar]
- 43.Paris-Robidas S, Brouard D, Emond V, Parent M, Calon F, Internalization of targeted quantum dots by brain capillary endothelial cells in vivo. J. Cereb. Blood Flow Metab 36, 731–742 (2015). [DOI] [PMC free article] [PubMed] [Google Scholar]
- 44.Daniels-Wells TR, Penichet ML, Transferrin receptor 1: A target for antibody-mediated cancer therapy. Immunotherapy 8, 991–994 (2016). [DOI] [PubMed] [Google Scholar]
- 45.Lieberman LA, Tsokos GC, The IL-2 defect in systemic lupus erythematosus disease has an expansive effect on host immunity. J. Biomed. Biotechnol 2010, 740619 (2010). [DOI] [PMC free article] [PubMed] [Google Scholar]
- 46.Zheng X, Tsou PS, Sawalha AH, Increased expression of EZH2 is mediated by higher glycolysis and mTORC1 activation in lupus CD4+ T cells. Immunometabolism 2, e200013 (2020). [DOI] [PMC free article] [PubMed] [Google Scholar]
- 47.Wu B, Goronzy JJ, Weyand CM, Metabolic fitness of T cells in autoimmune disease. Immunometabolism 2, e200017 (2020). [DOI] [PMC free article] [PubMed] [Google Scholar]
- 48.Watson A, Lipina C, McArdle HJ, Taylor PM, Hundal HS, Iron depletion suppresses mTORC1-directed signalling in intestinal Caco-2 cells via induction of REDD1. Cell Signal. 28, 412–424 (2016). [DOI] [PMC free article] [PubMed] [Google Scholar]
- 49.Shang C, Zhou H, Liu W, Shen T, Luo Y, Huang S, Iron chelation inhibits mTORC1 signaling involving activation of AMPK and REDD1/Bnip3 pathways. Oncogene 39, 5201–5213 (2020). [DOI] [PMC free article] [PubMed] [Google Scholar]
- 50.Wincup C, Radziszewska A, Abnormal mitochondrial physiology in the pathogenesis of systemic lupus erythematosus. Rheum. Dis. Clin. North Am 47, 427–439 (2021). [DOI] [PubMed] [Google Scholar]
- 51.Jastroch M, Divakaruni AS, Mookerjee S, Treberg JR, Brand MD, Mitochondrial proton and electron leaks. Essays Biochem. 47, 53–67 (2010). [DOI] [PMC free article] [PubMed] [Google Scholar]
- 52.Hin N, Newman M, Pederson S, Lardelli M, Iron responsive element-mediated responses to iron dyshomeostasis in Alzheimer’s disease. J. Alzheimers Dis 84, 1597–1630 (2021). [DOI] [PubMed] [Google Scholar]
- 53.Wilkinson N, Pantopoulos K, The IRP/IRE system in vivo: Insights from mouse models. Front. Pharmacol 5, 176 (2014). [DOI] [PMC free article] [PubMed] [Google Scholar]
- 54.Teh MR, Frost JN, Armitage AE, Drakesmith H, Analysis of iron and iron-interacting protein dynamics during T-cell activation. Front. Immunol 12, 714613 (2021). [DOI] [PMC free article] [PubMed] [Google Scholar]
- 55.Saraiva M, Christensen JR, Veldhoen M, Murphy TL, Murphy KM, O’Garra A, Interleukin-10 production by Th1 cells requires interleukin-12-induced STAT4 transcription factor and ERK MAP kinase activation by high antigen dose. Immunity 31, 209–219 (2009). [DOI] [PMC free article] [PubMed] [Google Scholar]
- 56.Gibson-Corley KN, Olivier AK, Meyerholz DK, Principles for valid histopathologic scoring in research. Vet. Pathol 50, 1007–1015 (2013). [DOI] [PMC free article] [PubMed] [Google Scholar]
- 57.Klarquist J, Janssen EM, The bm12 inducible model of systemic lupus erythematosus (SLE) in C57BL/6 Mice. J. Vis. Exp 105, e53319 (2015). [DOI] [PMC free article] [PubMed] [Google Scholar]
- 58.Brown AC, Lupus erythematosus and nutrition: A review of the literature. J. Ren. Nutr 10, 170–183 (2000). [DOI] [PubMed] [Google Scholar]
- 59.Marks ES, Bonnemaison ML, Brusnahan SK, Zhang W, Fan W, Garrison JC, Boesen EI, Renal iron accumulation occurs in lupus nephritis and iron chelation delays the onset of albuminuria. Sci. Rep 7, 12821(2017). [DOI] [PMC free article] [PubMed] [Google Scholar]
- 60.Shan J, Jin H, Xu Y, T cell metabolism: A new perspective on Th17/Treg cell imbalance in systemic lupus erythematosus. Front. Immunol 11, 1027 (2020). [DOI] [PMC free article] [PubMed] [Google Scholar]
- 61.Karmaus PWF, Chen X, Lim SA, Herrada AA, Nguyen TLM, Xu B, Dhungana Y, Rankin S, Chen W, Rosencrance C, Yang K, Fan Y, Cheng Y, Easton J, Neale G, Vogel P, Chi H, Metabolic heterogeneity underlies reciprocal fates of TH17 cell stemness and plasticity. Nature 565, 101–105 (2019). [DOI] [PMC free article] [PubMed] [Google Scholar]
- 62.Wu L, Hollinshead KER, Hao Y, Au C, Kroehling L, Ng C, Lin W-Y, Li D, Silva HM, Shin J, Lafaille JJ, Possemato R, Pacold ME, Papagiannakopoulos T, Kimmelman AC, Satija R, Littman DR, Niche-selective inhibition of pathogenic Th17 cells by targeting metabolic redundancy. Cell 182, 641–654.e20 (2020). [DOI] [PMC free article] [PubMed] [Google Scholar]
- 63.Grant SM, Wiesinger JA, Beard JL, Cantorna MT, Iron-deficient mice fail to develop autoimmune encephalomyelitis. J. Nutr 133, 2635–2638 (2003). [DOI] [PubMed] [Google Scholar]
- 64.Wang Z, Yin W, Zhu L, Li J, Yao Y, Chen F, Sun M, Zhang J, Shen N, Song Y, Chang X, Iron drives T helper cell pathogenicity by promoting RNA-binding protein PCBP1-mediated proinflammatory cytokine production. Immunity 49, 80–92.e7 (2018). [DOI] [PubMed] [Google Scholar]
- 65.Beebe AM, Cua DJ, de Waal Malefyt R, The role of interleukin-10 in autoimmune disease: Systemic lupus erythematosus (SLE) and multiple sclerosis (MS). Cytokine Growth Factor Rev. 13, 403–412 (2002). [DOI] [PubMed] [Google Scholar]
- 66.Llorente L, Zou W, Levy Y, Richaud-Patin Y, Wijdenes J, Alcocer-Varela J, Morel-Fourrier B, Brouet JC, Alarcon-Segovia D, Galanaud P, Emilie D, Role of interleukin 10 in the B lymphocyte hyperactivity and autoantibody production of human systemic lupus erythematosus. J. Exp. Med 181, 839–844 (1995). [DOI] [PMC free article] [PubMed] [Google Scholar]
- 67.Yang X, Sun B, Wang H, Yin C, Wang X, Ji X, Increased serum IL-10 in lupus patients promotes apoptosis of T cell subsets via the caspase 8 pathway initiated by Fas signaling. J. Biomed. Res 29, 232–240 (2015). [DOI] [PMC free article] [PubMed] [Google Scholar]
- 68.Amend A, Wickli N, Schafer AL, Sprenger DTL, Manz RA, Voll RE, Chevalier N, Dual role of interleukin-10 in murine NZB/W F1 lupus. Int. J. Mol. Sci 22, 1347 (2021). [DOI] [PMC free article] [PubMed] [Google Scholar]
- 69.Wynn JL, Scumpia PO, Stocks BT, Romano-Keeler J, Alrifai MW, Liu J-H, Kim AS, Alford CE, Matta P, Weitkamp J-H, Moore DJ, Neonatal CD71+ erythroid cells do not modify murine sepsis mortality. J. Immunol 195, 1064–1070 (2015). [DOI] [PMC free article] [PubMed] [Google Scholar]
- 70.Haider L, Simeonidou C, Steinberger G, Hametner S, Grigoriadis N, Deretzi G, Kovacs GG, Kutzelnigg A, Lassmann H, Frischer JM, Multiple sclerosis deep grey matter: The relation between demyelination, neurodegeneration, inflammation and iron. J. Neurol. Neurosurg. Psychiatry 85, 1386–1395 (2014). [DOI] [PMC free article] [PubMed] [Google Scholar]
- 71.Baker JF, Ghio AJ, Iron homoeostasis in rheumatic disease. Rheumatology (Oxford) 48, 1339–1344 (2009). [DOI] [PubMed] [Google Scholar]
- 72.Hochberg MC, Updating the American College of Rheumatology revised criteria for the classification of systemic lupus erythematosus. Arthritis Rheum. 40, 1725 (1997). [DOI] [PubMed] [Google Scholar]
- 73.Sugiura A, Andrejeva G, Voss K, Heintzman DR, Xu X, Madden MZ, Ye X, Beier KL, Chowdhury NU, Wolf MM, Young AC, Greenwood DL, Sewell AE, Shahi SK, Freedman SN, Cameron AM, Foerch P, Bourne T, Garcia-Canaveras JC, Karijolich J, Newcomb DC, Mangalam AK, Rabinowitz JD, Rathmell JC, MTHFD2 is a metabolic checkpoint controlling effector and regulatory T cell fate and function. Immunity 55, 65–81.e9 (2021). [DOI] [PMC free article] [PubMed] [Google Scholar]
- 74.Rossiter NJ, Huggler KS, Adelmann CH, Keys HR, Soens RW, Sabatini DM, Cantor JR, CRISPR screens in physiologic medium reveal conditionally essential genes in human cells. Cell Metab. 33, 1248–1263.e9 (2020). [DOI] [PMC free article] [PubMed] [Google Scholar]
- 75.Voss K, Luthers CR, Pohida K, Snow AL, Fatty acid synthase contributes to restimulation-induced cell death of human CD4 T cells. Front. Mol. Biosci 6, 106 (2019). [DOI] [PMC free article] [PubMed] [Google Scholar]
Associated Data
This section collects any data citations, data availability statements, or supplementary materials included in this article.
Supplementary Materials
Data Availability Statement
The deposited data for RNA sequencing experiments are available under the NCBI GEO accession number GSE212663. All materials using or generated in this study are available to researchers following appropriate standard material transfer agreement.