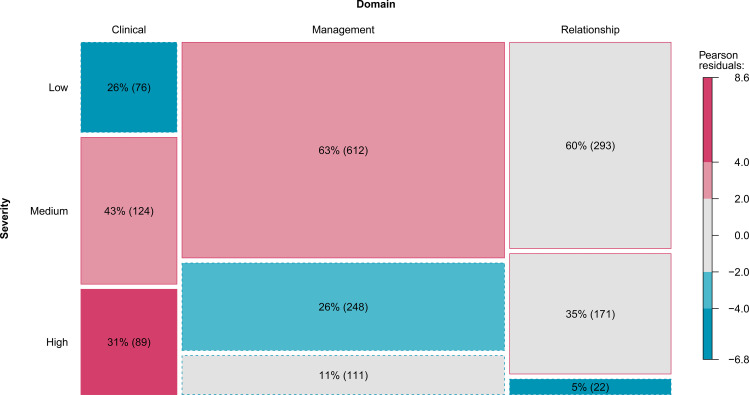
Figure 6.
Three types patient care process related complaints and severity.a
Notes: aRectangular area indicates the frequency of complaints in each domain with different severity. The number indicates the complaints percentage of rectangular area in the same column and the frequency in brackets. Solid rectangular area boundaries correspond to more observations than expected and fewer dotted lines. The absolute Pearson’s chi-squared test residual value of gray is <2 (P>0.05), light color is 2–4 (P<0.05), and dark color is >4 (P<0.0001).

