Table 2.
Cardiac magnetic resonance assessments of myocardial injury and fibrosis
| Condition | Typical findings in early disease | Typical findings in established disease | T1 mapping appearance | LGE appearance | Current and Emerging Clinical Roles |
|---|---|---|---|---|---|
| Myocardial infarction | • Increased T2, 18F-FDG PET, native T1 and ECV% values • Subendocardial or transmural LGE: reflecting myocyte necrosis and oedema |
• Subendocardial or transmural pattern of LGE reflecting established scar • Normal T1 values in remote myocardium |

|


|
Current Diagnosis: Differentiation of ischaemic heart disease vs. dilated cardiomyopathy and in presentations of MINOCA5,53Prognosis: LGE associated with increased all cause and cardiovascular mortality42Viability assessments: Guide consideration of coronary revascularisation |
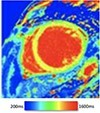
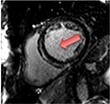
| Dilated cardiomyopathy | • Interstitial fibrosis generally precedes replacement fibrosis: raised native T1, ECV% | • Linear mid-wall or subepicardial LGE -T1 markers increased interstitial fibrosis commonly co-exist |
|

|
Current Diagnosis: Differentiation of ischaemic heart disease vs. dilated cardiomyopathy5Prognosis: • LGE associated with increased mortality43 and dysrhythmia41 • Raised native T1 and ECV% associated with increased all-cause mortality and/or heart failure hospitalisation or heart failure death48,54Emerging Fibrosis assessments to guide ICD implantation: CMR-GUIDE, CMR-ICD |
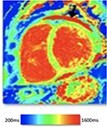
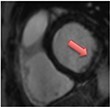
| Myocarditis | • Increased T2 and 18F-FDG PET (oedema & inflammation) • Focal mid-wall and subendocardial LGE (necrosis and oedema) |
• Mid-wall and subendocardial LGE (established replacement fibrosis) • Patients may go on to develop a dilated cardiomyopathy phenotype |
|

|
Current Diagnosis: Differentiation for other cause of acute chest pain and troponin elevation (e.g. myocardial infarction, Tako-tsubo cardiomyopathy etc.) Prognosis: LGE associated with increased mortality and major adverse cardiovascular events44 |
| Sarcoidosis | • Patchy areas of increased T2 and 18F-FDG PET (oedema & inflammation) • Focal non-infarct pattern of LGE (necrosis, oedema granuloma formation) |
• Patchy non-infarct pattern of LGE often within the subepicardium and mid-wall • Persistent elevated T2 and 18F-FDG activity may or may not be present as evidence of ongoing active disease |

|

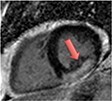
|
Current Diagnosis: Central role in the diagnosis of cardiac sarcoid Prognosis: LGE associated with increased cardiovascular death and ventricular dysrhythmia45 |
| Hypertrophic cardiomyopathy | • Raised native T1 and ECV% compared to normal myocardium but overlap with other disease states | • Mid-wall LGE within hypertrophied segments and ventricular insertion points |
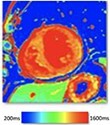
|
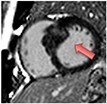
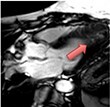
|
Current Diagnosis: Differentiation from phenocopies e.g. hypertension, Fabry’s, amyloid Prognosis: High volume LGE associated with increased mortality and ventricular dysrhythmia/sudden cardiac death46Emerging Assessing the effects of novel medication. Guiding ICD implantation |
| Aortic stenosis | • Raised native T1, ECV% and iECV | • Non-infarct mid-wall LGE |
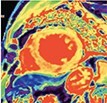
|
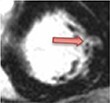
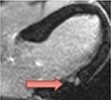
|
Current Diagnosis: Markers of fibrosis provide objective markers of LV decompensation Prognosis: • LGE associated with increased mortality11 • Raised native T1 and ECV% associated with increased mortality,49,55 and native T1 with heart failure hospitalisation55Emerging Optimizing the timing of valve replacement |
| Heart failure with preserved ejection fraction | • Diffusely raised native T1 values | • Non-infarct mid-wall or epicardial LGE has been described |
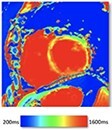
|
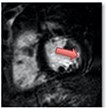
|
Current Diagnosis: Establishing the diagnosis and identifying the underlying cause as well as exclusion of other conditions (e.g. pericardial constriction, pulmonary hypertension) Prognosis: LGE and raised T1 associated with hospitalisation and mortality47 |
The pattern and timing of fibrosis formation and its corresponding imaging findings vary in different cardiomyopathic disorders. Current methods of assessing myocardial fibrosis have several defined and emerging roles in clinical practice. Native T1 values represent interstitial fibrosis with higher values represented by yellow, orange, or red voxels. Late gadolinium enhancement (white areas in the otherwise black myocardium) represents replacement fibrosis. Increased T2 values indicate myocardial oedema suggestive of inflammation.52 Native T1 image in myocardial infarction courtesy of Dr Trisha Singh, in dilated cardiomyopathy, myocarditis, hypertrophic cardiomyopathy, and heart failure with preserved ejection fraction reprinted from Haaf et al.,56 in sarcoidosis from Chang et al.,57 and in aortic stenosis from Lee et al.55 Images depicting late gadolinium enhancement adapted from Bing et al.,5 asides upper sarcoidosis image (Chang et al.)57 and heart failure with preserved ejection fraction (Haaf et al.).5618F-FDG PET, 18F-fluorodeoxyglucose positron emission tomography; ECV%, percentage of extracellular volume; LGE, late gadolinium enhancement; MINOCA, myocardial infarction with non-obstructive coronary arteries; ICD, implantable cardiac defibrillator; iECV, indexed extracellular volume; LV, left ventricular.
