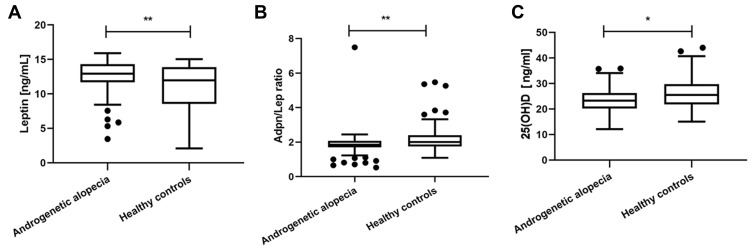
Figure 1.
Serum concentrations of leptin, Adpn/Lep ratio and 25(OH)D in patients with AGA and healthy controls. (a) In compare to healthy group, AGA patients showed higher leptin level. (b) In compare to healthy group, AGA patients showed lower Adpn/Lep ratio. (c) In compare to healthy group, AGA patients showed lower 25(OH)D level. *Indicates statistically significant difference, p value<0.05; **Indicates statistically significant difference, p value<0.01.

