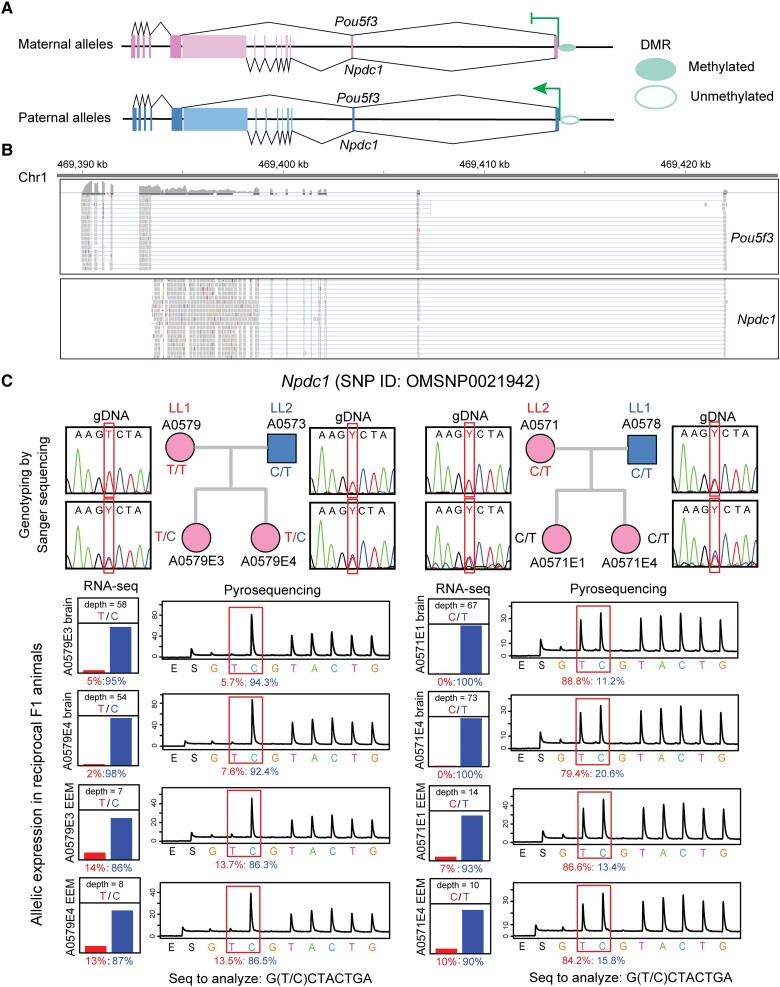
Fig. 2.
Gene structure and parent-of-origin-specific expression ratios at a novel imprinting cluster on chromosome 1 in Monodelphis domestica fetal brain and placenta. (A) Npdc1 and Pou5f3 gene models inferred from RNA-seq data. Exons are represented by rectangle boxes, and DMRs are drawn as open (unmethylated) and filled (methylated) oval shapes. (B) RNA-seq read alignments in Npdc1 and Pou5f3 gene regions demonstrated by tracks from Integrative Genomics Viewer (IGV). (C) Top: Npdc1 SNP genotypes in parental and F1 animals determined by Sanger sequencing in LL1 (dam) × LL2 (sire) and reciprocal LL2 × LL1 crosses. Bottom: Npdc1 differential allelic expression profile estimated from RNA-seq (left) and validated by allele-specific pyrosequencing (right) in the two reciprocal crosses. The maternal allelic percentages are shown in red and paternal percentages are shown in blue.

