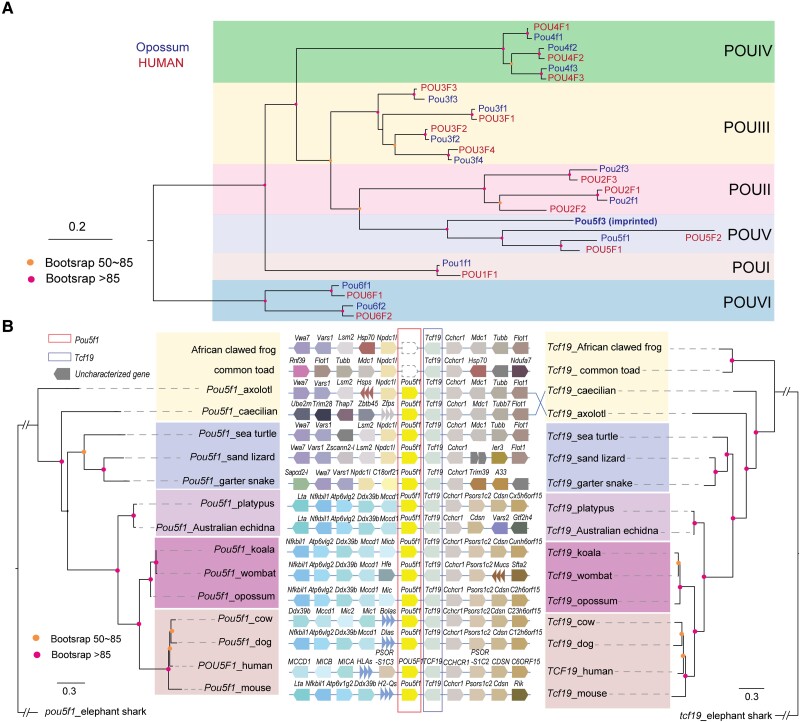
Fig. 5.
Genome neighborhood and phylogenetic analysis of Pou5f1-Tcf19 in selected vertebrate species. (A) Phylogenetic tree of members in six POU domain families in Monodelphis domestica and Homo sapiens. (B) Maximum likelihood trees of protein sequences from Pou5f1 (left) and its adjacent gene Tcf19 (right), using their orthologs in elephant shark as the outgroup. Nodes with bootstrap values larger than 85% are labeled in red, and those between 50 and 85% are labeled in orange. The gene synteny in the genome neighborhood is shown in the middle panel, and dotted line boxes represent the loss of Pou5f1 in African clawed frog and common toad.

