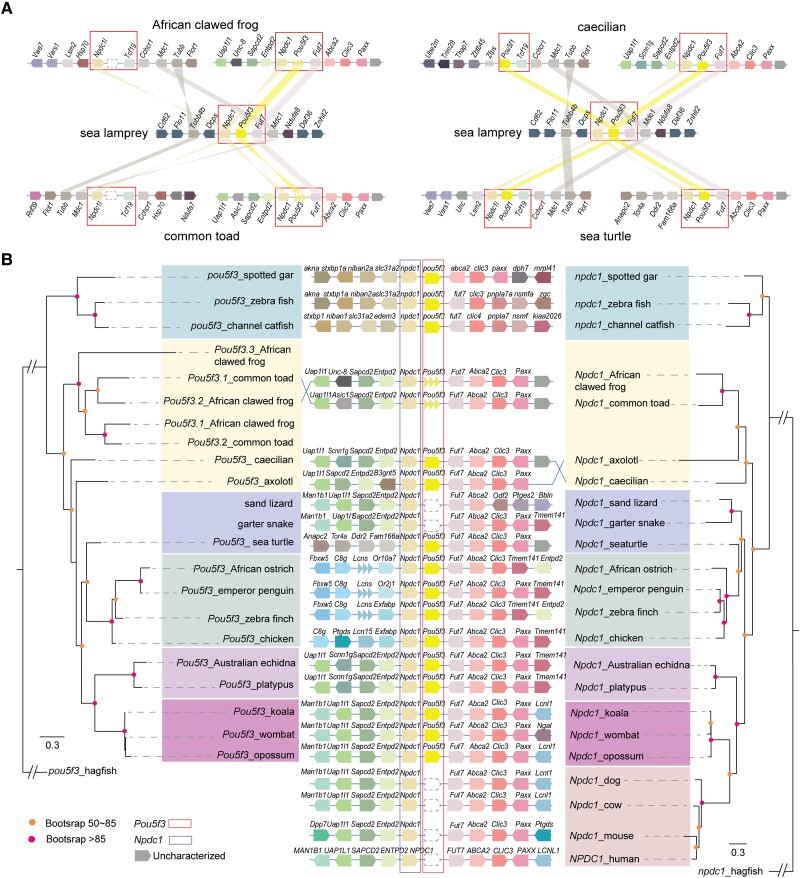
Fig. 6.
Genome neighborhood and phylogenetic analysis of Pou5f3-Npdc1 in selected vertebrate species. (A) Comparative synteny analysis of the Npdc1-Pou5f3-Fut7 loci between sea lamprey and other vertebrates (African clawed frog, common toad, caecilian, and sea turtle). (B) Maximum likelihood trees of protein sequences from Pou5f3 (left) and Npdc1 (right), using orthologs in hagfish as the outgroup. Nodes with bootstrap values larger than 85% are labeled in red, and those between 50 and 85% are labeled in orange. Synteny in the genome neighborhood is shown in the middle panel, and dotted line boxes represent gene loss.

