
FIGURE 1.
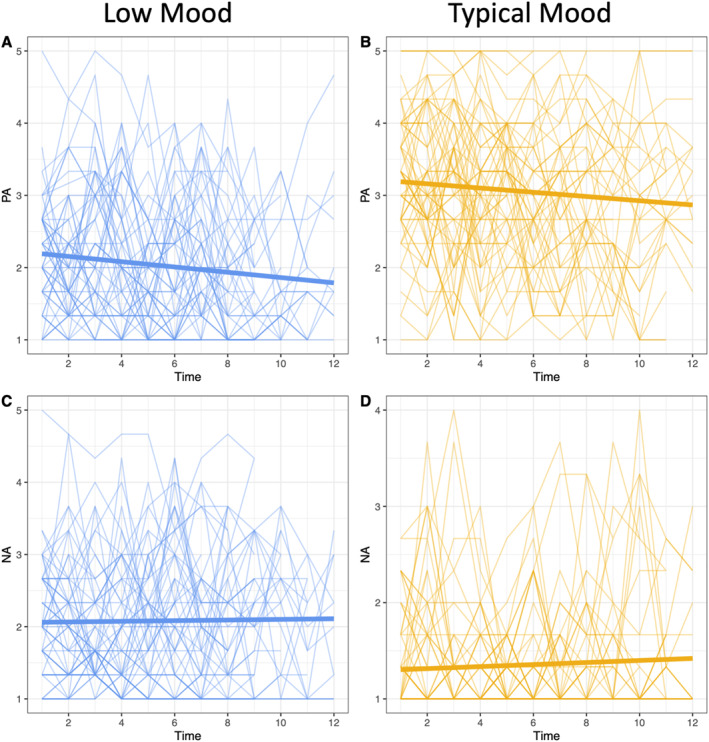
Positive affect (PA) (Top Row) and negative affect (NA) (Bottom Row) scores over time for the Low Mood (Left Column) and Typical Mood (TM) (Right Column) participants. Thicker lines represent group means.
Official websites use .gov
A
.gov website belongs to an official
government organization in the United States.
Secure .gov websites use HTTPS
A lock (
) or https:// means you've safely
connected to the .gov website. Share sensitive
information only on official, secure websites.
Positive affect (PA) (Top Row) and negative affect (NA) (Bottom Row) scores over time for the Low Mood (Left Column) and Typical Mood (TM) (Right Column) participants. Thicker lines represent group means.