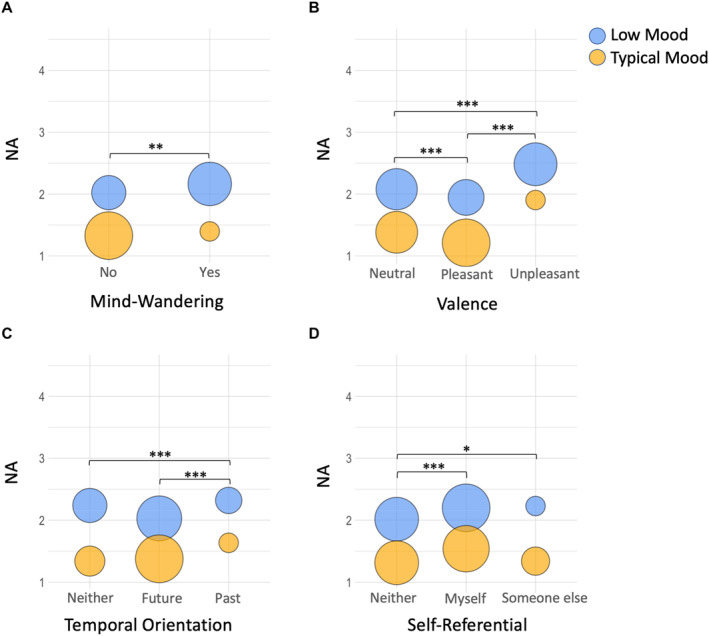
FIGURE 2.

Mean negative affect (NA) for Low Mood (LM) and Typical Mood (TM) groups as a function of mind‐wandering, as well as the valence, temporal orientation, and self‐referential quality of thoughts. Bubble area is proportional to the frequency of ecological momentary assessment (EMA) samples for that group. For example, for the top left panel, the LM group were more likely to report mind‐wandering at EMA timepoints relative to the TM group (55.6% vs. 37.6%, respectively). The bubble sizes are proportional to these percentages. *p < .05; **p < .01; ***p < .001
