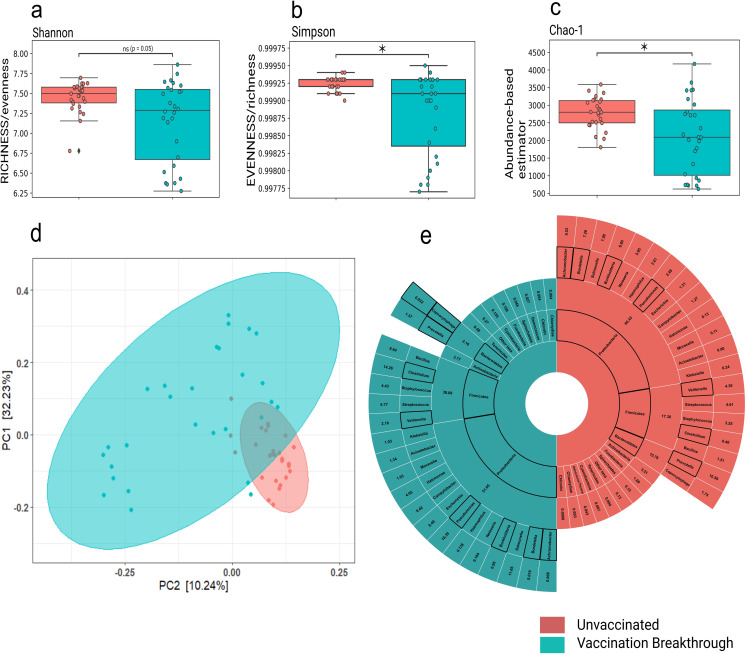
Fig 2. Microbial abundance, richness and evenness distribution across the vaccination breakthrough and the unvaccinated patients.
Alpha diversity: a) Shannon (Richness), b) Simpson (Evenness), c) Chao-1 (Abundance-based estimator) showing significant changes in microbiome abundance for vaccination breakthrough and unvaccinated patients, with p-values calculated by the Kruskal Wallis test. d) Beta diversity: Principal Coordinate Analysis (PCoA) shows the differential composition of the nasopharyngeal microbes between vaccination breakthrough and the unvaccinated patients. (e) Illustration of the percent differential abundance of phyla and genera across unvaccinated and vaccination breakthrough cases.

