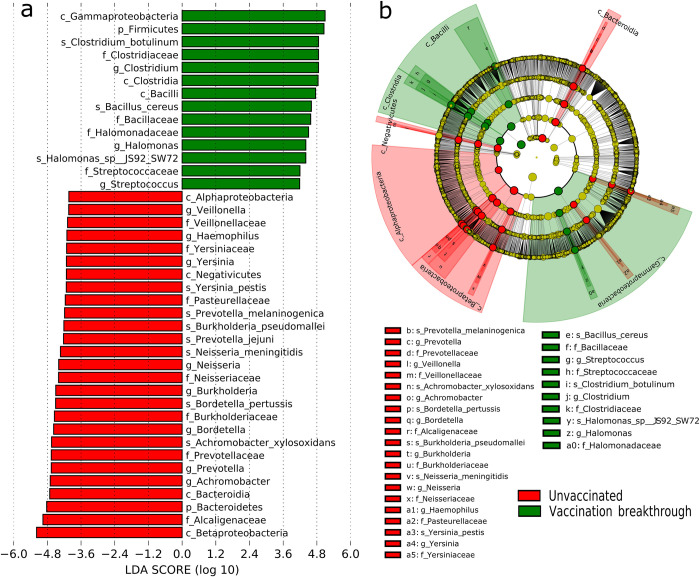
Fig 3. Microbial features across unvaccinated and vaccination breakthrough cohorts.
(a) Cladogram (b) Histogram. Differential taxa between two groups selected on the basis of discriminative features by LEfSe analysis (LDA scores >4.0). Green and red indicate taxa enriched in the vaccination breakthrough and the unvaccinated patients, respectively. Depiction of the most abundant microbes at different levels in each group: k, kingdom; p, phylum; f, family; c, class; g, genus; s, species.

