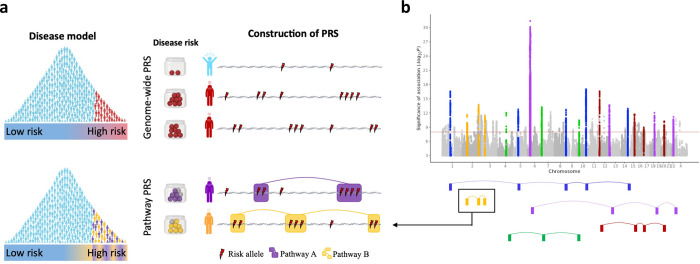
Fig 1. The pathway polygenic risk score approach.
Coloured boxes represent genes, lines link genes that are within the same genomic pathway. A, Upper model: Classical polygenic model of disease, in which individuals lie on a linear spectrum from low to high risk and genome-wide PRSs are constructed as the sum of risk alleles across the genome. Disease risk depicted by the Jar model [18]. Lower model: Pathway polygenic model of disease, in which there are multiple liabilities and PRSs are constructed by aggregating risk alleles over different genomic pathways. B, GWAS results Manhattan plot illustrated as a hypothetical composite of signals, where each signal corresponds to an alternative functional route to disease. Pathways that only make a small contribution to disease risk across the population, or a contribution in a small fraction of individuals (e.g. nicotine receptor pathway in those individuals who smoke), are likely to harbour risk variants of relatively small effect. Figure partially created with BioRender.com.

