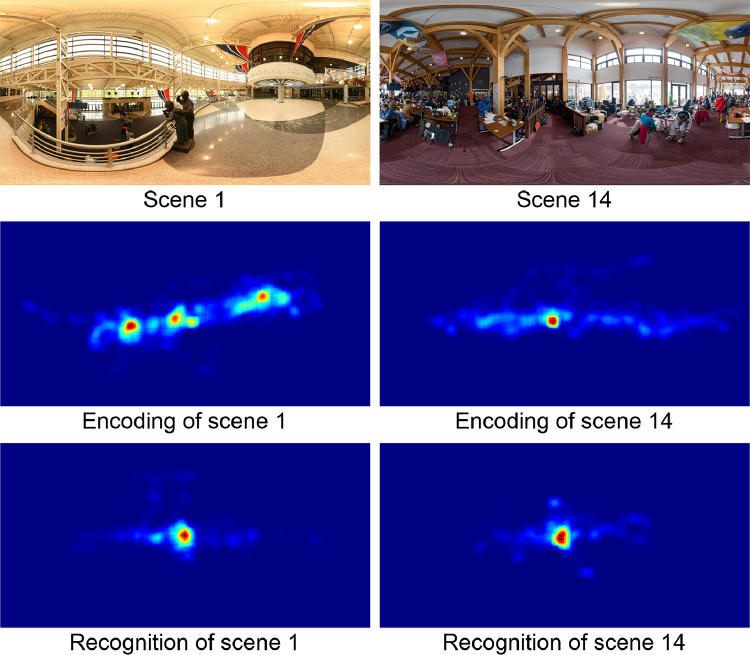
Fig 4. Head position heatmaps for two sample scenes.
The original images are shown in the top panels, the heatmaps of the encoding head positions in the middle panels, and the heatmaps of the recognition head positions in the bottom panels. The heatmaps are color-coded, with red indicating the strongest values and blue indicating the weakest values.

