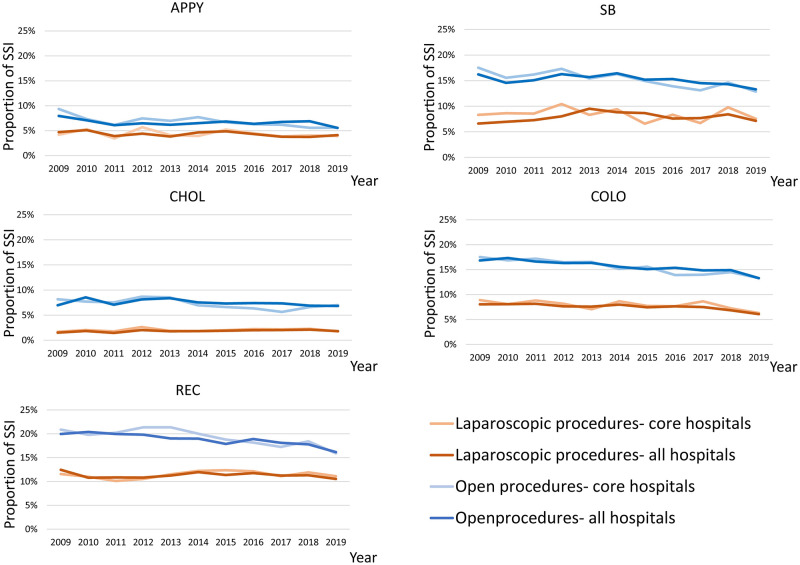
Fig 3. Proportion of surgical site infection for each of the five digestive surgeries stratified by laparoscopic and other procedures, as well as the core and all hospitals.
The blue line shows the surgical site infection rate for open procedures in all participating hospitals. The light blue line shows the surgical site infection rate for open procedures in the core participating hospitals. The orange line shows the surgical site infection rate for laparoscopic procedures in all participating hospitals. The light orange line shows the surgical site infection rate for laparoscopic procedures in the core participating hospitals.

