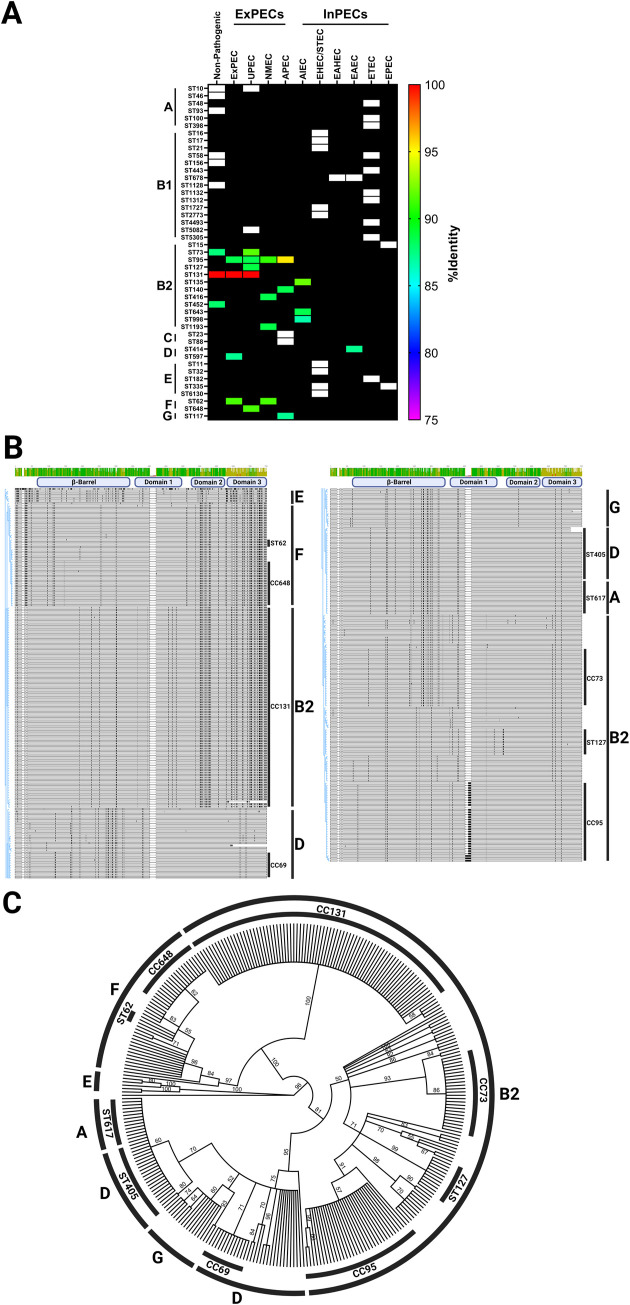
Fig 1. Comparative genomics heatmap, amino acid sequence alignment, and phylogenetic tree of sinH sequence.
(A) Pathotype, phylogroup, sequence types of distribution of sinH sequence. Heatmap showing nonpathogenic E. coli, ExPECs and InPECs. Columns are organized by pathotypes, and rows are organized first by phylogroups, then by sequence types. Each cell in the heatmap is colored based on percent nucleotide identity compared to the reference used to generate the alignments, and the black boxes indicate there is no sequence type (ST) present for the listed pathotype whereas white boxes indicate there is a sequence type but it does not contain a sinH homolog. (B) MAFFT alignment of the amino acid sequence of SinH. Alignment is annotated with phylogroup and sequence type. An identity histogram is shown at the top, and black represents amino acid differences from the majority consensus. (C) Consensus maximum-likelihood phylogenetic tree of SinH generated from alignment shown in Fig 1B using RAxML and rooted with Salmonella SinH. Branch labels indicate percentage support from 100 rapid bootstrap replicates. The consensus tree and alignment were annotated in BioRender.

