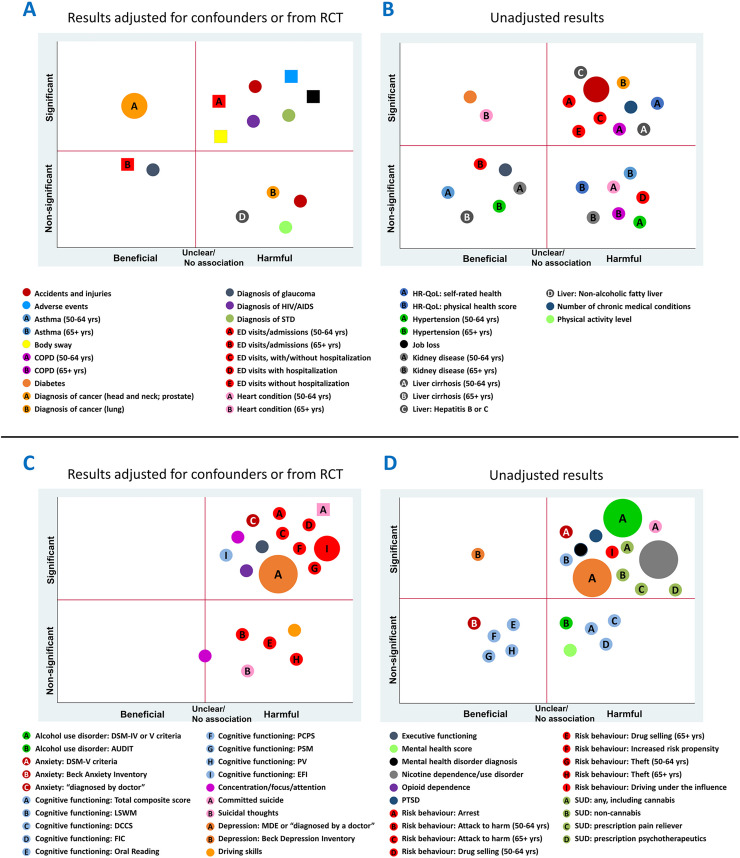
Fig 5. Bubble plots of findings from population-based studies and studies of healthy older adults.
Findings at a glance: Observed associations of cannabis use with physical health outcomes (Panels A, B) and mental health outcomes (Panels C, D), with separate plots for adjusted analyses/RCTs and unadjusted analyses. Some associations were derived from studies with cross-sectional and case-control designs (circles), while others were derived from cohort studies and RCT (squares). Quadrants of plots represent significant and non-significant beneficial and harmful effects. Each bubble represents an outcome definition for which at least one study reported an effect within a plot quadrant. Bubble size represents the number of studies that reported that outcome definition in the quadrant. Letters within bubbles denote subgroups or different outcome definitions within an outcome group.

