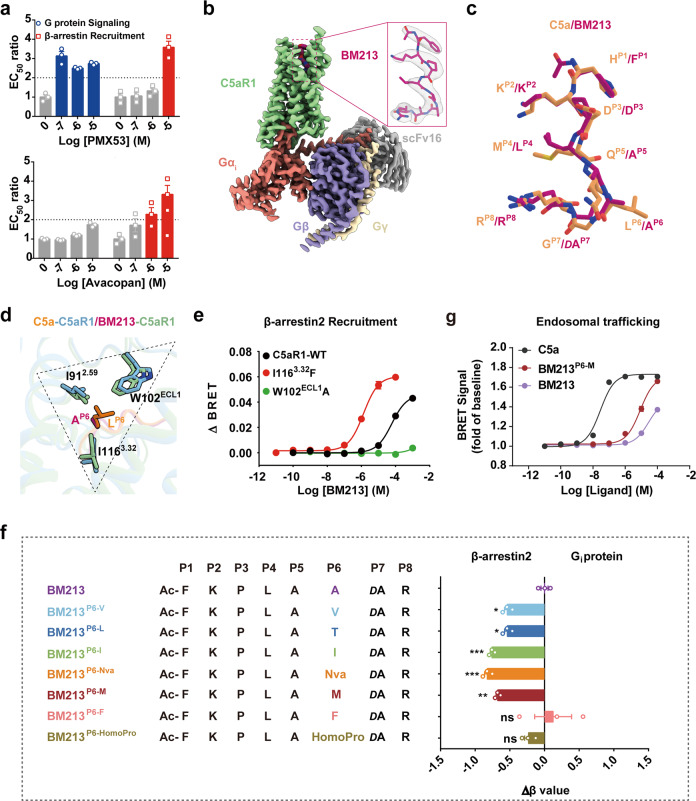
Fig. 4. Structural basis of the biased agonism induced by BM213.
a The biased antagonism induced by orthosteric ligand PMX53 (upper panel) and allosteric ligand Avacopan (lower panel). The EC50 values are derived from curve fit parameters from Supplementary information, Fig. S8b, c. Data are presented as the means ± SEM of three independent experiments performed in triplicate. b Cryo-EM maps of BM213-bound C5aR1–Gi complexes. Medium violet red, BM213; pale green, BM213-bound C5aR1; salmon, Gαi; slate blue, Gβ; wheat, Gγ; dark gray, scFv16. c Structural alignment of BM213 with C5a. The superimposition was based on the receptor. Sandy brown, C5a; hot pink, BM213. d Structural comparison of the interactions between LP6 of C5a and C5aR1 with those between AP6 of BM213 and C5aR1. e Representative curves for effects of the I1163.32F and W102ECL1A mutations in C5aR1 on BM213-induced β-arrestin 2 recruitment detected by BRET assay. Data are presented as the means ± SEM of three independent experiments performed in triplicate. f Substitution of AP6 in BM213 with bulkier residues induces β-arrestin 2-biased signaling relative to BM213. Bias factors were derived from curve fit parameters from Supplementary information, Fig. S10a, and were calculated using the endogenous agonist C5a as the reference. Statistical differences were determined by one-way ANOVA followed by the Dunnett’s multiple comparison test compared with BM213. *P < 0.05 **P < 0.01, ***P < 0.001; ns, no significance. Data are presented as the means ± SEM of three independent experiments performed in triplicate. g BRET-based agonist-dependent endosomal trafficking analysis of C5aR1 in HEK293 cells transfected with FYVE-mVenues. BRET ratio (30 min) is shown as fold of baseline; and data are the means ± SEM of three independent experiments performed in triplicate.

