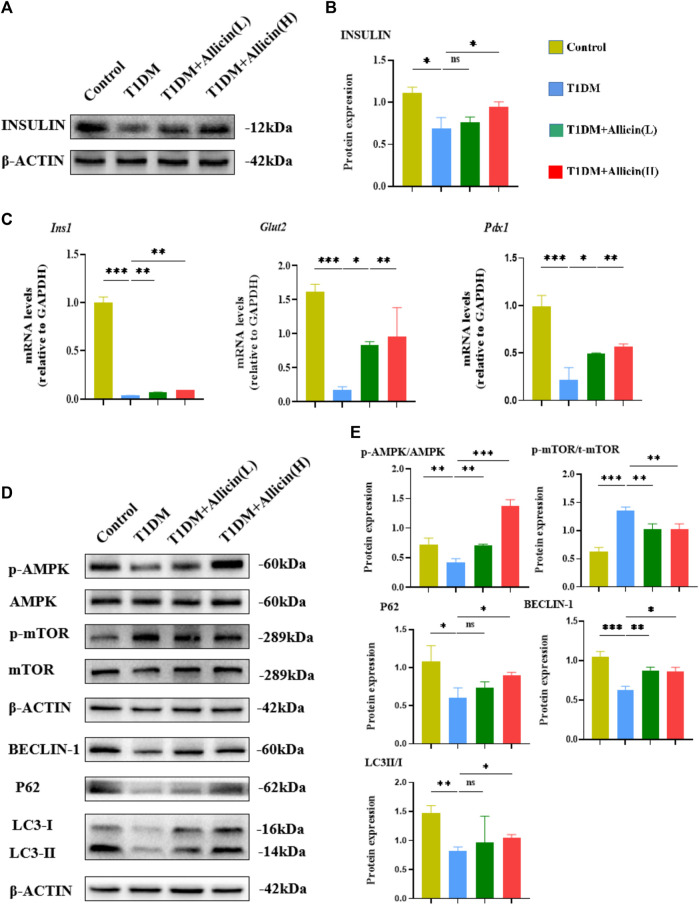
FIGURE 3.
Allicin mediated pancreatic β cell autophagy through activating AMPK/mTOR pathway in T1DM mice. (A) Western blot gel images of INSULIN and β-ACTIN in each group. (B) The bar graph represents the quantification of gel bands. (C) The mRNA levels of Ins1, Glut2, and Pdx1 in each group by RT-qPCR (n = 3). (D) The western blot gel images of proteins in AMPK/mTOR-mediated autophagy flux pathway in each group. (E) The bar graphs represent the quantification of gel bands (n = 3). Mean ± SD. * p < .05, ** p < .01, *** p < .001 indicate significant differences, and ns > .05 shows no difference.

