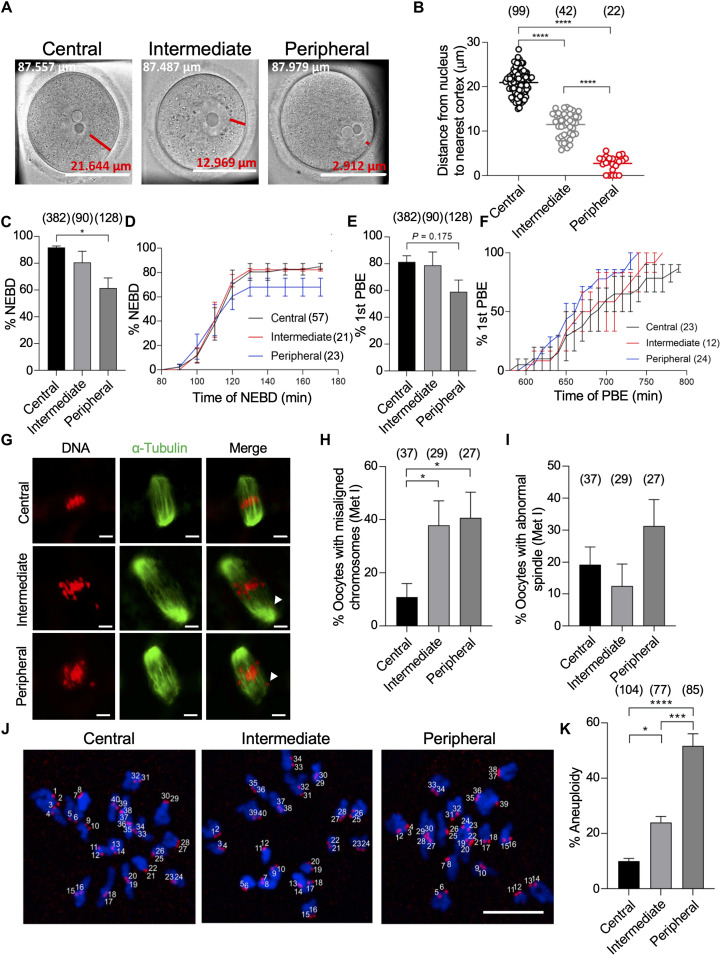
Fig. 1. Oocytes with a peripherally located nucleus have higher rates of chromosome misalignment and aneuploidy.
(A) Full-grown germinal vesicle (GV) oocytes were sorted into central, intermediate, or peripheral GV oocytes. Scale bars, 50 μm. Oocyte diameter is included in the top left of each image (white text); distance from the nucleus to the cortex is included above the scale bar (red text). (B) Quantification of the average distance from the nucleus to the nearest cortex within groups. (C to F) Central, intermediate, and peripheral GV oocytes were imaged live using time-lapse microscopy during in vitro maturation (IVM) and assessed for the percentage of oocytes that underwent nuclear envelope breakdown (NEBD) (C), the average time of NEBD (D), the percentage of first polar body extrusion (1st PBE) (E), and the average time of PBE calculated from oocytes successfully extruded the PB (F). (G to K) Central, intermediate, and peripheral GV oocytes were in vitro matured for 7 hours (metaphase I) or 14 hours (metaphase II). Metaphase I oocytes were immunostained with α-tubulin to label the spindle. Metaphase II oocytes were assessed for aneuploidy. Oocytes containing greater or less than 40 kinetochores (stained with CREST) were scored as aneuploid. DNA was labeled by 4′,6-diamidino-2-phenylindole (DAPI). (G) Representative confocal images of metaphase I oocytes. (H) Quantification of the percentage of chromosome misalignment in (G). (I) Quantification of the percentage of abnormal spindle morphology in (G). (J) Representative images of metaphase II oocytes assessed for aneuploidy. (K) Quantification of the percentage of aneuploidy. Scale bar, 10 μm. One-way analysis of variance (ANOVA) and Tukey’s post hoc tests were performed to determine statistical significance among groups. Data are displayed as means ± SEM. Values with asterisks vary significantly, *P < 0.05; ***P < 0.001; ****P < 0.0001. The total number of analyzed oocytes (from at least three independent replicates) is specified in each graph.

