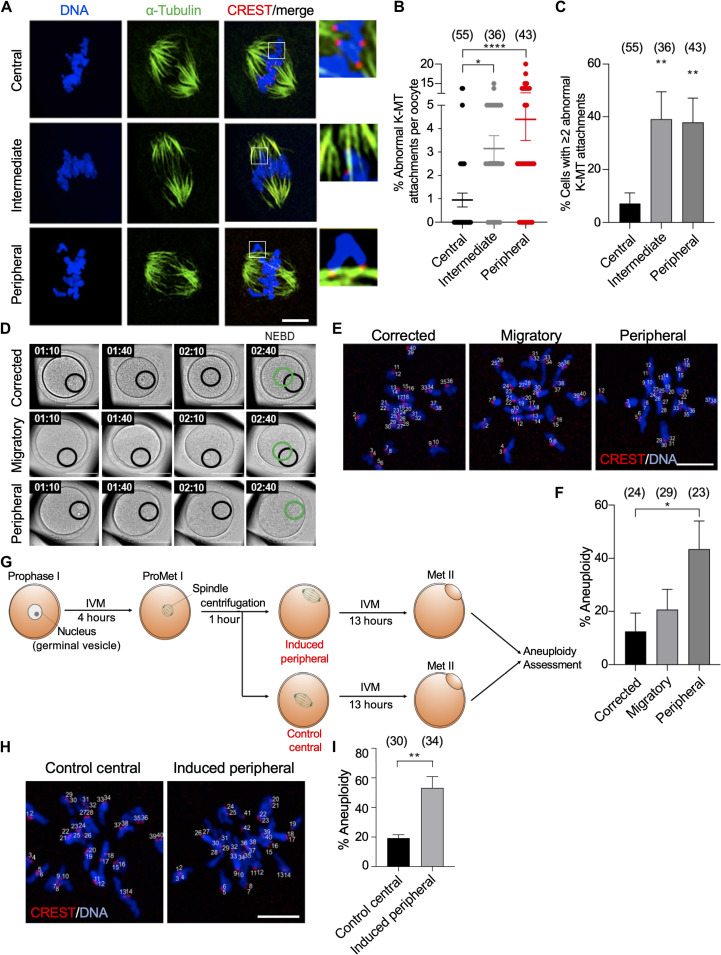
Fig. 2. Incidence of incorrect K-MT attachments and aneuploidy associate with spindle proximity to the cortex.
(A) Representative confocal images of kinetochore-microtubule (K-MT) attachments in central, intermediate, or peripheral GV oocytes matured to metaphase I and immunostained with α-tubulin (to label MTs) and CREST (to label kinetochores). DNA was stained with DAPI. Scale bar, 10 μm. (B) Quantification of abnormal K-MT attachments. (C) Quantification of the oocytes with two or more incorrect K-MT attachments. One-way ANOVA and Tukey’s post hoc test were performed to analyze the data. (D) Representative images of the nucleus movement before NEBD. The black circle denotes the primary nucleus positioning, while the green circle denotes the final nucleus position before NEBD. Scale bars, 50 μm. (E) Representative images of aneuploidy in oocytes experiencing full migration of the nucleus (corrected/central), attempted migration of their nucleus (migratory), or not attempting central migration of the nucleus (peripheral). Scale bar, 10 μm. (F) Quantification of the incidence of aneuploidy in metaphase II oocytes from the oocytes categorized in (D). One-way ANOVA and Tukey’s post hoc test were performed to analyze the data. (G) Schematic depicting the induction of peripheral spindle positioning by mild centrifugation of central GV oocytes. (H) Representative images of aneuploidy in oocytes either maintaining central spindle positioning after centrifugation or induced peripheral spindle positioning after centrifugation. Scale bar, 10 μm. (I) Quantification of the incidence of aneuploidy in oocytes with induced peripherally positioned nucleus and centrally positioned nucleus after centrifugation. Student’s t test was performed to determine statistical significance. Data are displayed as means ± SEM. Values with asterisks vary significantly, *P < 0.05; **P < 0.01; ****P < 0.0001. The total number of analyzed oocytes (from at least three independent replicates) is specified above each graph.

