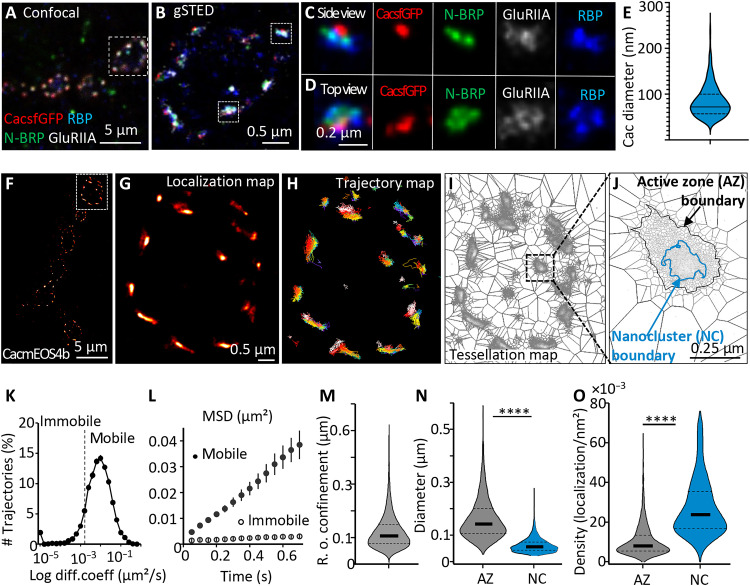
Fig. 1. Live in vivo mobility and distribution of individual VGCCs at Drosophila NMJ synapses.
(A to D) Representative four-channel confocal (A) and gSTED (B to D) images of NMJs (muscle 4) of third-instar larvae. Differential labeling of AZs with CacsfGFP (red), BRP N terminus (green), and RBP C terminus (blue) and of postsynaptic GluRIIA (gray) is evident on the side and top views (C and D). (E) Sizing of Cac signal diameter by measuring the Feret’s diameter. N = 441 planar AZs from five animals, 24 images derived from n = 2 independent sets. (F to J) Live Cac channel dynamics based on sptPALM of CacmEOS4b in 1.5 mM Ca2+ extracellular imaging buffer. Localization, trajectory, and tessellation maps (G to I) of the boxed bouton in (F) illustrate the stepwise analysis leading to the identification of Cac nanoclusters (NCs) inside AZs (I and J). (K to O) Quantification of live dynamics of Cac sptPALM imaging from 24 animals, N = 70 regions of interest (ROIs), 1166 AZs, where 14,013 trajectories were analyzed. (K to M) Tessellation analysis revealed the diameters of AZs and NCs (N) and the density of Cac channel localizations within AZ and NC boundaries (O). Data distribution was statistically tested by the Kolmogorov-Smirnov test. Statistical significance is denoted as asterisks: ****P < 0.0001. Scale bars, 5 μm (A and F), 0.5. μm (B and F), and 200 nm (C and D).

