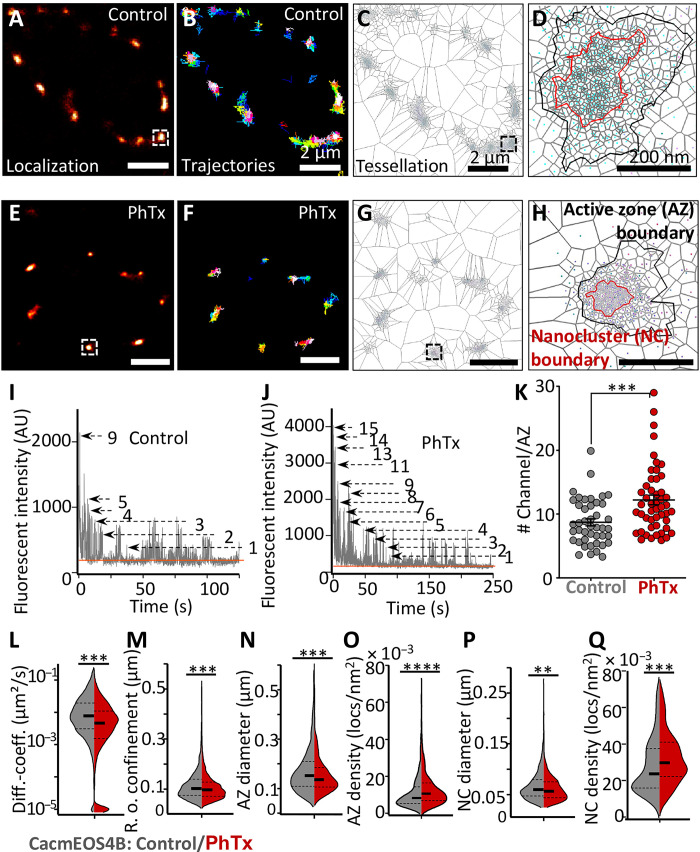
Fig. 2. Live in vivo imaging of Cac channels at remodeling AZs.
(A to H) Live sptPALM imaging of CacmEOS4b at muscle 4 or 6/7 NMJs, performed in 1.5 mM Ca2+ 5 min after a 10-min incubation in HL3 with PhTx or in plain HL3 (Control). Images show representative PALM recordings (A and E), trajectory maps (B and F), and tessellation analysis representations of CacmEOS4B (C, D, G, and H). Scale bars, 2 μm (A to C and E to G) and 200 nm (D and H). (I and J) Recording of stepwise photobleaching as a reference for counting the relative number of CacmEOS4b molecules within AZs of control and PhTx-treated NMJs during a period of continuous illumination (405 nm/561 nm). (K) Quantification of channel numbers from bleaching curves (I and J), derived from the same sptPALM recordings used in (L to Q). A total of 43 AZs (control) and 49 AZs (PhTx) were analyzed based on 12 to 16 images/NMJ from three to four animals for each condition, P < 0.0003 (unpaired t-test). (L and M) Quantification of diffusion coefficients and radii of confinement from live Cac channel sptPALM imaging. Control NMJs: NMJs from 18 animals, N = 54 ROIs; 8013 trajectories; PhTx-treated NMJs: 20 animals, N = 58 ROIs; 9139 trajectories. (N to Q) Tessellation analysis from the same sptPALM dataset was analyzed in (A) to (K) for diameters and densities of Cac channel localizations within AZ and NC cluster boundaries. Here, 54/58 ROIs from 18/19 animals generated 644 AZs (control) and 892 AZs (PhTx), respectively, that were analyzed. Statistical significance is denoted as asterisks: **P < 0.01, ***P < 0.001, and ****P < 0.0001. Data distribution was statistically tested with a Kolmogorov-Smirnov test. AU, arbitrary units.

