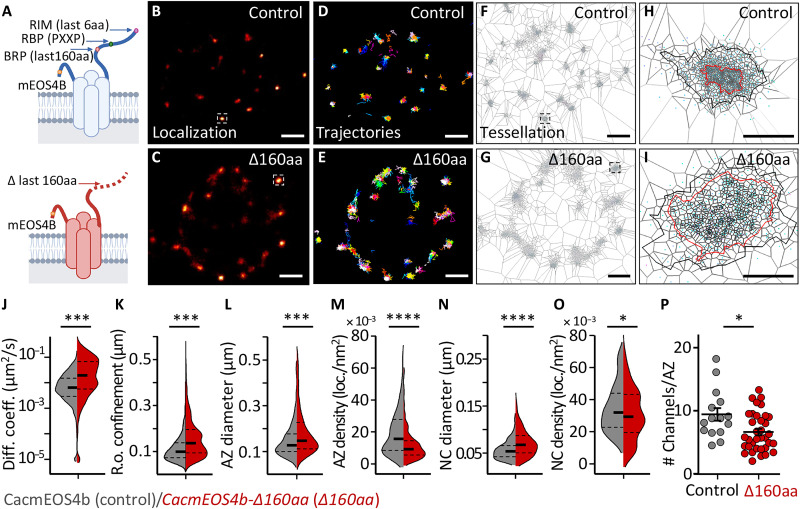
Fig. 4. Live in vivo imaging of Cac channels in CacmEOS4B∆160aa mutants.
(A) Schematic diagram of on-locus deletion mutant CacmEOS4B-∆160aa animals generated from endogenously tagged CacmEOS4B control flies. (B to I) Representative live sptPALM imaging of CacmEOS4B (Control or Con) and CacmEOS4B-∆160aa (∆160aa) mutants imaged in 1.5 mM Ca2+ extracellular imaging buffer displaying the PALM localization (B and C), trajectory map (D and E), and a visualization of the tessellation analysis (F to I) in CacmEOS4B/Control and ∆160aa boutons (F and G) and individual AZs (H and I). Scale bars, 1 μm (A to C and E to G) and 200 nm (D and H). (J and K) Live sptPALM diffusion coefficient (J), the radius of confinement quantification of CacmEOS4B and CacmEOS4B∆160aa NMJs (K), 8 (Con) and 6 (∆160aa) animals, N = 23 ROIs (Con) and 15 ROIs (∆160aa), 2996 trajectories (Con) and 2436 trajectories (∆160aa). (L to O) Tessellation analysis of the diameter and density of Cac channel localizations within AZ (L and M) and NC (N and O) cluster boundaries based on the same data, containing 303 (Con) and 371 (∆160aa) AZs analyzed in n = 3 independent sptPALM ∆160aa experiments that were conducted with concurrent controls. PALM data distribution was statistically tested by the Kolmogorov-Smirnov test. Statistical significance is denoted as asterisks: *P < 0.05; ***P < 0.001; ****P < 0.0001. (P) For comparison, quantification of Cac channel numbers extracted from the same live sptPALM data was further characterized within control conditions [for CacmEOS4b (Con) and CacmEOS4b∆160aa (∆160aa) mutants]. The data were obtained from three to four ROIs out of three to four animals per condition from which 43 AZs (Con) and 49 AZs (PhTx) were analyzed. P < 0.0003 (unpaired t-test). N = 12 to 16 ROIs from four animals per condition from which 15 AZs (Con) and 35 AZs (∆160aa) were analyzed. P < 0.0003 (unpaired t test).

