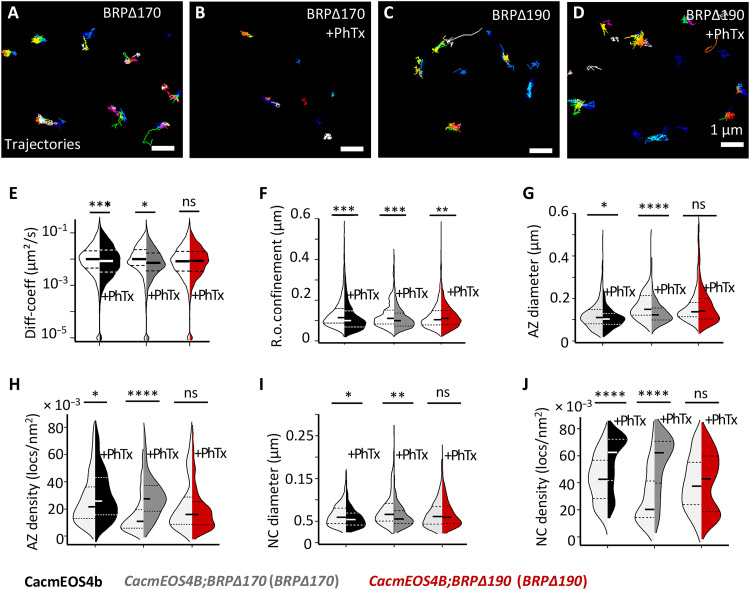
Fig. 7. Live in vivo imaging of Cac channels in BRP∆170 and BRP∆190 mutant in CacmEOS4b background at normal and remodeling AZs.
(A to J) Live sptPALM imaging of CacmEOS4B (Con), CacmEOS4B;BRP∆170/brp69 (BRP∆170) mutants (A and B), and CacmEOS4B;BRP∆190/brp69 (BRP∆190) mutants (C and D) that were preincubated in 10-min PhTx in HL3 (B and D) or plain HL3 (A and C). These were imaged in 1.5 mM Ca2+ extracellular imaging buffer images via sptPALM from which trajectory maps (A to D) and tessellation analysis were calculated. Scale bars, 1 μm (A to D). (E and F) Analysis of live sptPALM diffusion coefficient (E) and radius of confinement (F) quantification of CacmEOS4B, BRP∆190, and BRP∆170 mutants with and without PhTx treatment. (G) N = 25 ROIs, 10 animals, and 4861 trajectories (Con); N = 21 ROIs, 9 animals, and 3428 trajectories (Con + PhTx); N = 9 ROIs, 4 animals, and 1096 trajectories (BRP∆170); N = 22 ROIs, 6 animals, and 3942 trajectories (BRP∆170 + PhTx); N = 22 ROIs, 8 animals, and 3951 trajectories (BRP∆190); and N = 18 ROIs, 7 animals, and 5657 trajectories (BRP∆190 + PhTx). ROIs from n = 2 experiment conducted with concurrent controls. (G to J) Tessellation analysis of the diameter and density of Cac channel localizations within AZ (G and H) and NC (I and J) cluster boundaries from N = 37 ROIs, 10 animals, and 471 AZs (Con); N = 33 ROIs, 9 animals, and 470 AZs (Con + PhTx); N = 25 ROIs, 7 animals, and 120 AZs (BRP∆170); N = 23 ROIs, 6 animals, and 236 AZs (BRP∆170 + PhTx); N = 26 ROIs, 8 animals, and 273 AZs (BRP∆190); and N = 24, 7 animals, and 445 AZs (BRP∆190+ PhTx). n = 2 individual experiments conducted with concurrent controls. PALM data distribution was statistically tested by the Mann-Whitney U test followed by the Kolmogorov-Smirnov test. All PALM data distribution was statistically tested by a Kolmogorov-Smirnov test. Statistical significance is denoted as asterisks: *P < 0.05, **P < 0.01, ***P < 0.001, and ****P < 0.0001.

