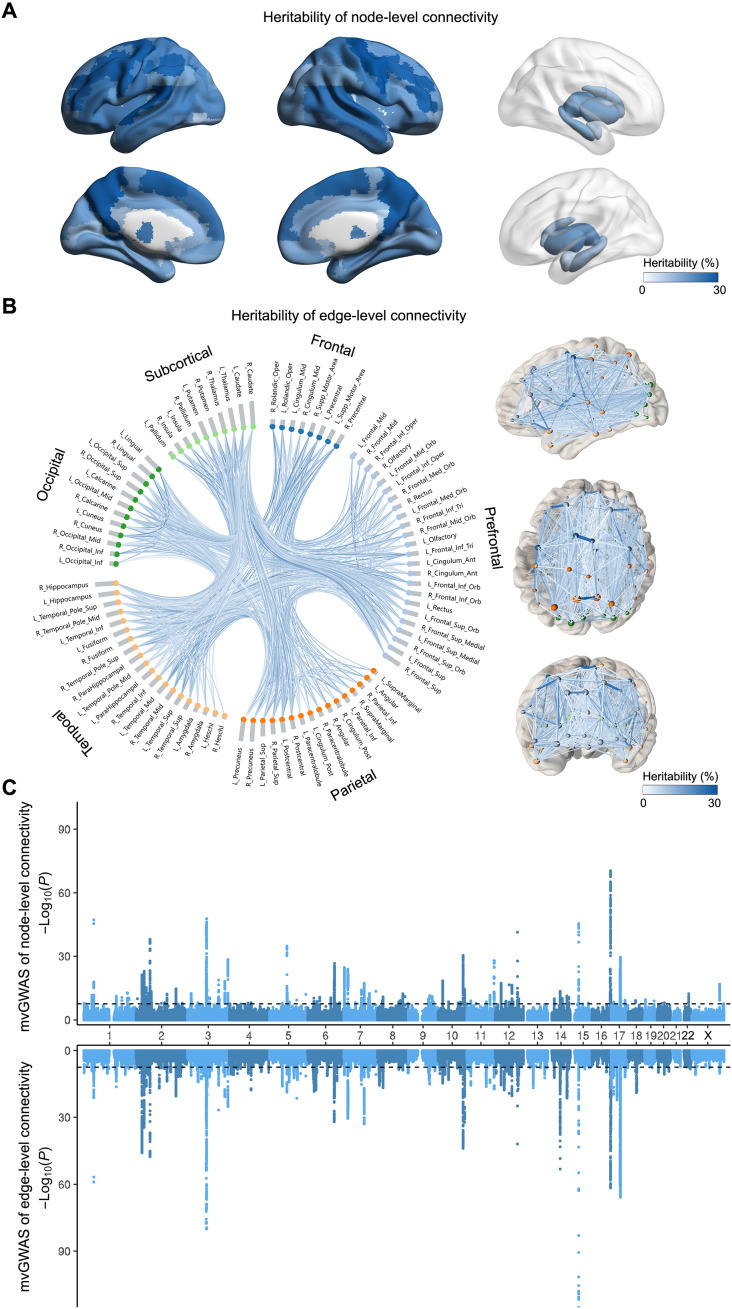
Fig. 2. SNP-based heritability and mvGWAS analyses of node-level connectivity and edge-level connectivity in 30,810 participants.
(A) All 90 node-level (i.e., regional) connectivities showed significant SNP-based heritability after Bonferroni correction, ranging from 7.8 to 29.5%. (B) Eight hundred fifty-one of 947 edge-level connectivities showed significant SNP-based heritability after Bonferroni correction, ranging from 4.6 to 29.5%. Right: Brain maps. Left: Nodes grouped by frontal, prefrontal, parietal, temporal, and occipital cortical lobes and subcortical structures. Heritabilities can be visualized interactively in a dynamic Web-based interface (see “Data and materials availability” statement). (C) Miami plot for mvGWAS of 90 node-level connectivities (top) and 851 edge-level connectivities (bottom). The black lines indicate the genome-wide significance threshold P < 2.5 × 10⁻⁸ (Materials and Methods).

