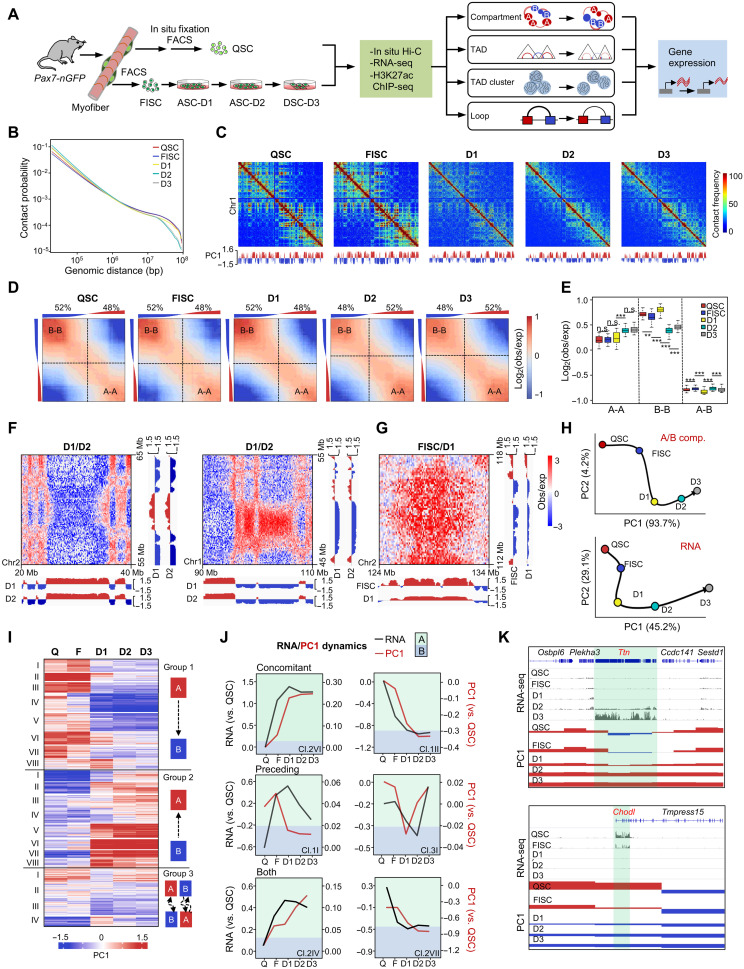
Fig. 1. Genome compartmentalization is globally reorganized and associated with gene expression during SC lineage development.
(A) Schematic overview of the study design. SCs were isolated from 2-month-old Pax7-nGFP mouse with or without in situ fixation to obtain QSCs or FISCs, respectively. FISCs were cultured in vitro for various times before collection for in situ Hi-C and RNA-seq. RNA-seq in QSC and H3K27Ac ChIP-seq data in QSC and FISC are from (23). (B) Contact probability relative to genomic distance. (C) Observed contact matrices for chromosome 1 at 500-kb resolution and the first eigenvector at 100-kb resolution. (D) Saddle plots showing the genome-wide compartmentalization. Percentage of compartment A/B and PC1 value of each 100-kb loci are shown on top. (E) Contact enrichment of 100-kb loci between compartments of the same and different types. **P < 0.001 and ***P < 0.0001; n.s., no significance, Wilcoxon signed-rank test. (F) Differential heatmaps for 10-Mb region on chromosome 2 showing increased A-A interactions (left) and decreased B-B interactions in D2 versus D1 (right). (G) Differential heatmap for 10-Mb region on chromosome 1 showing decreased A-B interactions in D1 versus FISC. (H) PCA of PC1 values and gene expression dynamics. Black arrows denote the hypothetical trajectory. (I) k-means clustering (k = 20) of PC1 values for 100-kb genomic bins that switch compartment at any time point. (J) Examples of individual switching clusters with concomitant PC1 and gene expression changes (VI/group 2 and II/group 1), PC1 changes preceding expression changes (I/group 1 and I/group 3), or clusters with both occurring (IV/group 2 and VII/group 2). (K) Genome browser view of Osbpl6-Ttn-Sestd1 (top) and Chodl-Tmpress15 (bottom) loci. PC1 and RNA-seq values at each stage are shown. Green shadings denote B-A switch (top) and A-B switch (bottom) regions.

