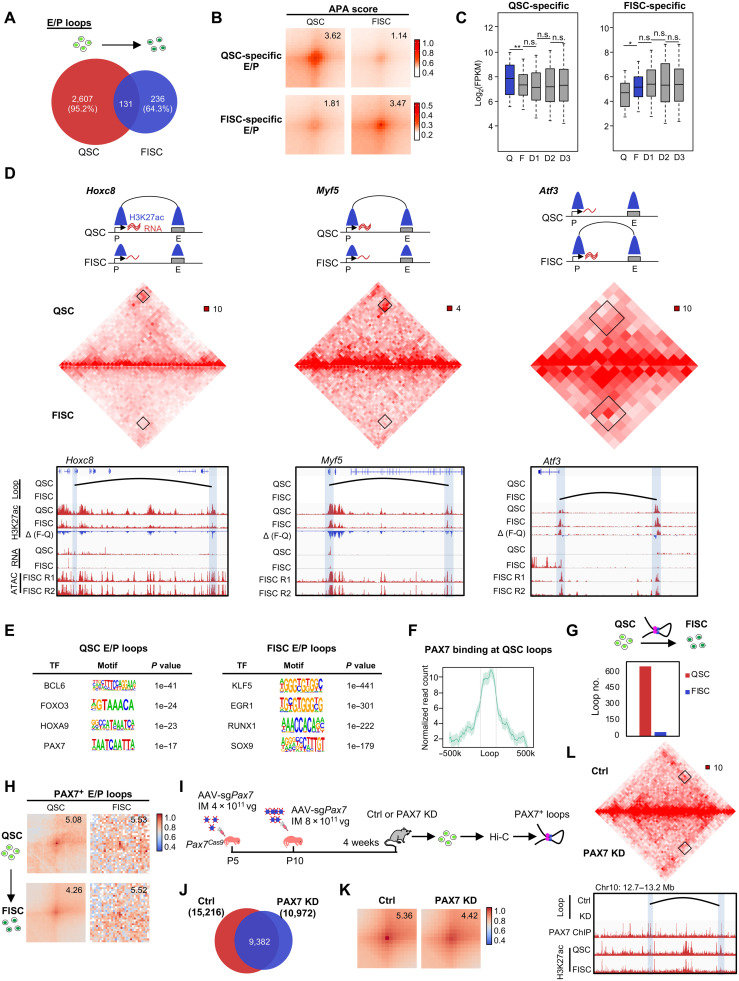
Fig. 4. PAX7 regulates E/P loop reorganization during SC early activation.
(A) Overlapping of E/P loops between QSC and FISC. (B) APA analysis of the QSC- or FISC-specific E/P loops. (C) Box plot depicting expression dynamics of genes within QSC-specific (left, n = 1874 genes) or FISC-specific (right, n = 469 genes) loops. *P < 0.01 and **P < 0.001, Wilcoxon signed-rank test. (D) Top: Illustration of the dynamics of E-P loop formation, H3K27ac signal, and gene expression on the Hoxc8 (left), Myf5 (center), and Atf3 (right) loci. Middle: Hi-C contact maps (5-kb resolution). Bottom: E-P loops are marked in black curve. Gene promoters and interacting regions are highlighted in blue boxes. Genome browser tracks showing H3K27ac ChIP-seq and RNA-seq in QSC and FISC, and ATAC-seq of two replicates in FISC. (E) HOMER predicted TF motifs enriched in the anchors of QSC- or FISC-specific E/P loops. (F) PAX7 occupancy in the anchor regions of QSC-specific loops. (G) Number of E/P loops with PAX7 binding at the anchors in FISC versus QSC. (H) APA analysis of the PAX7+ E/P loops showing decreased interaction intensity in FISC versus QSC. (I) Schematic illustration of PAX7 in vivo knockdown (KD) in SCs by the CRISPR-Cas9/AAV9-sgRNA editing system. The mice were sacrificed for QSC collection and subjected to Hi-C analysis after 4 weeks. (J) Overlapping of chromatin loops detected in the control (n = 15,216) and PAX7 KD (n = 10,972) groups. (K) APA analysis of the PAX7+ E/P loops showing decreased interaction intensity in PAX7 KD versus control (Ctrl). (L) Hi-C contact maps of a representative region showing the diminished Pax7+ loop formation in PAX7 KD versus Ctrl. Bin size, 10 kb. Black arc denotes the loop identified in Ctrl. The genome browser tracks show PAX7 and H3K27ac occupancy.

