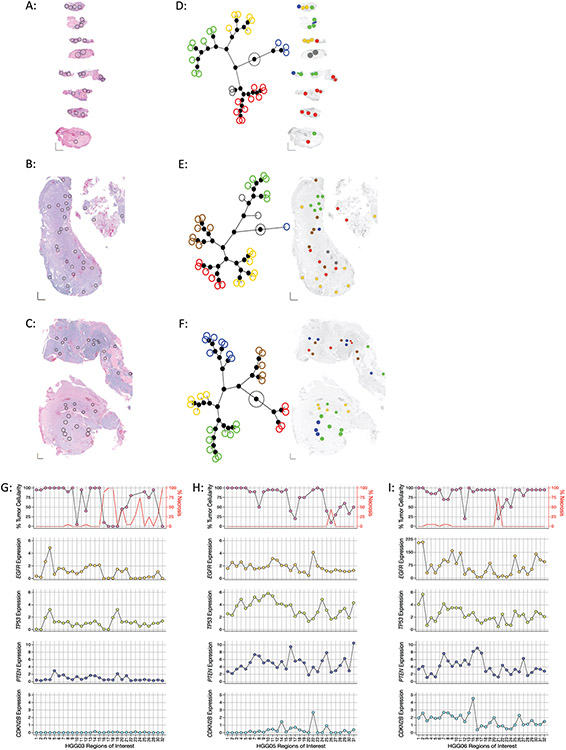
Figure 1: Regional intratumoral heterogeneity of gene expression profiles within individual glioblastoma specimens.
(A-C) Histology images of tumor samples (A) HGG03, (B) HGG05, and (C) HGG06 with spatially distinct regions of interest (ROIs) in each specimen indicated by black circles. XY scale bars in bottom left corner of each image represent 1000μm on each axis. (D-E) Left: Constellation plots depicting the unsupervised hierarchical clustering of the entire 1,700 gene panel in specimens (D) HGG03, (E) HGG05, and (F) HGG06 showing distinct transcriptionally associated clusters. Each colored circle corresponds to an individual ROI. Right: Spatial cluster maps showing the cluster identity and distribution of ROIs within each specimen where individual ROIs are colored according to their assigned clusters as indicated by the constellation plots on the left. (G-I) Regional heterogeneity in the expression of commonly altered glioblastoma tumor suppressor genes and oncogenes. Dot plots showing the percentage of viable tumor (top, left Y-axis), necrosis (top, right Y-axis) and the expression of EGFR (second row), TP53 (third row), PTEN (fourth row), and CDKN2B (bottom row) in each ROI in specimens (G) HGG03, (H) HGG05, and (I) HGG06. Percent tumor and necrosis were scored by standard neuropathological examination. ROI’s where tumor cellularity was ambiguous were not plotted.

