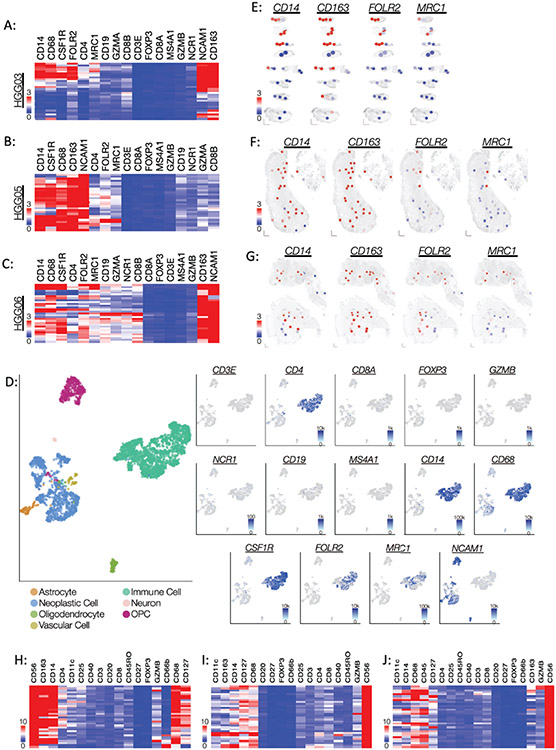
Figure 2: Regional expression of immune cell markers indicates a robust and widespread infiltration of macrophages.
(A-C) Heatmaps illustrating the unsupervised hierarchical clustering of the gene expression counts of lymphocyte and macrophage markers in specimens (A) HGG03, (B) HGG05, and (C) HGG06. Each row represents an individual ROI. Dendrograms were omitted to minimize figure congestion. (D) scRNA-seq data from glioblastoma tissue displayed as UMAP plots. Left: Cell type annotations. Right: Expression of individual lymphocyte and macrophage markers. (E-G) Spatial heatmaps demonstrating the distribution of pan-macrophage and M2-macrophage markers in specimens (D) HGG03, (E) HGG05, and (F) HGG06. (H-I) Heatmaps of the normalized antibody count data for lymphocyte and macrophage markers in specimens (H) HGG03, (I) HGG05, and (J) HGG06. The data are presented as fold change over mean IgG control value.

