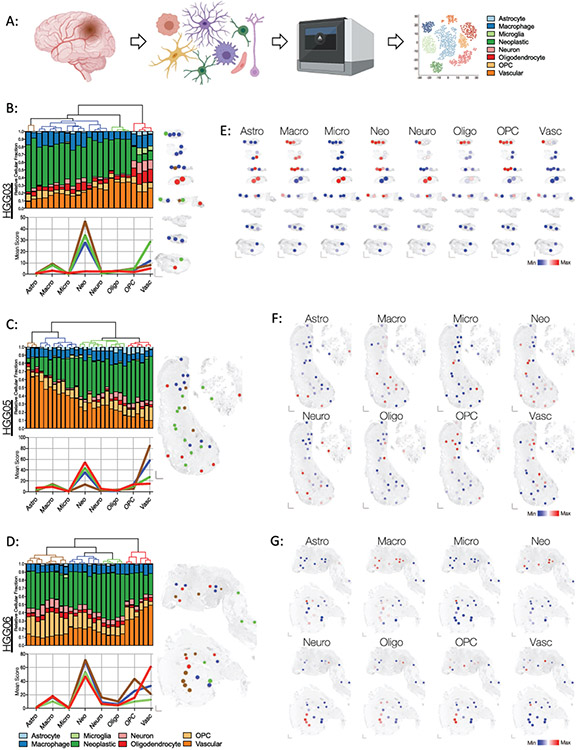
Figure 3: Spatially resolved enrichment of glioblastoma cell type-specific gene signatures using SpatialDecon mixed cell deconvolution.
(A) Schematic of SpatialDecon workflow and the cell types identified by this process. The color key for each inferred cell type is consistent throughout the figure. (B-D) Cellular composition of each ROI in specimens (B) HGG03, (C) HGG05, and (D) HGG06. Top: Unsupervised hierarchical clustering dendrograms and associated stacked bar graphs showing relative fraction of each inferred cell type score within each ROI (column). Bottom: Mean score for each inferred cell type in each of the clusters identified above. The graph lines are colored in accordance with their assigned clusters designated by the dendrogram above. Right: Spatial cluster maps showing the cluster identity and distribution of ROIs within each specimen. Individual ROIs are colored according to their assigned clusters as indicated by the dendrograms to the left. (E-G) Spatial heatmaps showing the relative inferred cell score in each of the ROIs within specimens (E) HGG03, (F) HGG05, and (G) HGG06. Abbreviations are as follows: Astro, astrocyte; Macro, macrophage; Micro, microglia; Neo, neoplastic cells; Neuro, Neuron, Oligo, oligodendrocyte; OPC, oligodendrocyte precursor cells; Vasc, vasculature.

