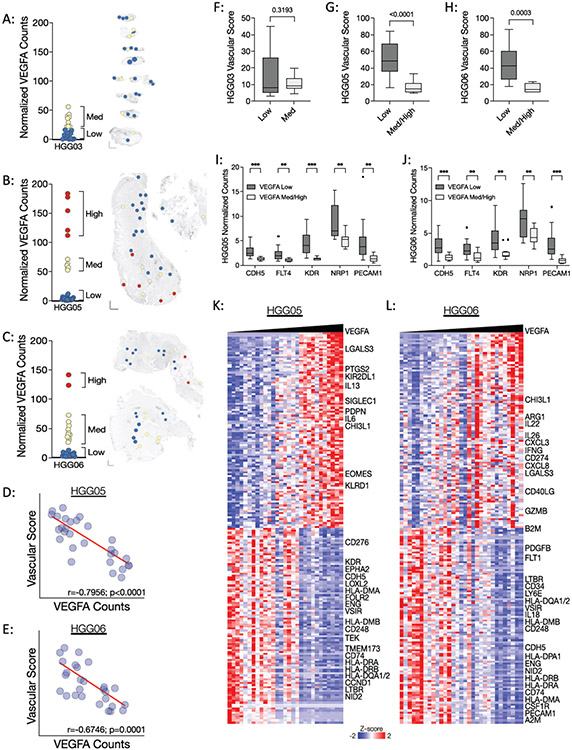
Figure 4: Regional heterogeneity in VEGFA gene expression inversely correlates with vascular abundance in specimens HGG05 and HGG06.
(A-C) Left: Dot plots of VEGFA expression in specimens (A) HGG03, (B), HGG05, and (C) HGG06. Right: Spatial heatmaps showing regions of low (blue ROIs), medium (yellow ROIs), and high (red ROIs) VEGFA expression in each corresponding specimen. (D-E) Spearman correlations between normalized VEGFA gene counts and the inferred vascular score in specimens (D) HGG05 and (E) HGG06. Correlation and significance values are listed along the X-axis of each scatter plot. (F-H) Box plots showing the vascular score in VEGFA-Low and VEGFA-Med/High ROIs in specimens (F) HGG03, (G) HGG05, and (H) HGG06. (I-J) Box plots showing the normalized gene counts of endothelial cell markers in VEGFA-Low and VEGFA-Med/High ROIs in specimens (I) HGG05 and (J) HGG06. Box plot p-values were calculated using an unpaired t-test with Welch’s correction where p < 0.05 is considered statistically significant. (K-L) Heatmaps showing the results of VEGFA nearest neighbors analysis in specimens (K) HGG05 and (L) HGG06.

