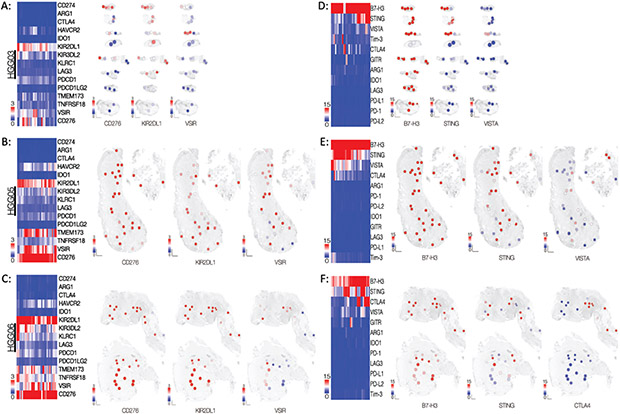
Figure 6: Immunotherapeutic targets are expressed in spatially distinct regions throughout the tissues.
(A-C, left) Heatmaps of the normalized count data for genes encoding immunotherapeutic targets in specimens (A) HGG03, (B) HGG05, and (C) HGG06. (A-C, right) Spatial heatmaps of specimens of each specimen depicting the normalized count data corresponding to the three genes with the highest median count value. (D-F, left) Heatmaps of the normalized antibody count data for immunotherapeutic targets in specimens (D) HGG03, (E) HGG05, and (F) HGG06. The data are presented as fold change over mean IgG control value. (D-E, right) Spatial heatmaps of each specimen showing the distribution of the normalized antibody count data for the three protein targets with the highest median value.

